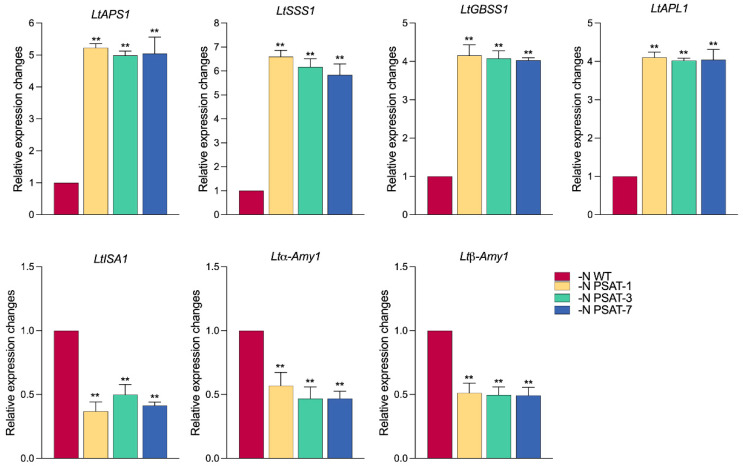
Figure 7.
Relative expression levels of genes related to starch synthesis and metabolism in duckweed after nitrogen starvation for 6 days. The relative expression level in WT was normalized to 1. Values given are mean ± standard error (n = 3). The double asterisk symbol (**) indicates highly significant differences (p < 0.01) according to one-way ANOVA.

