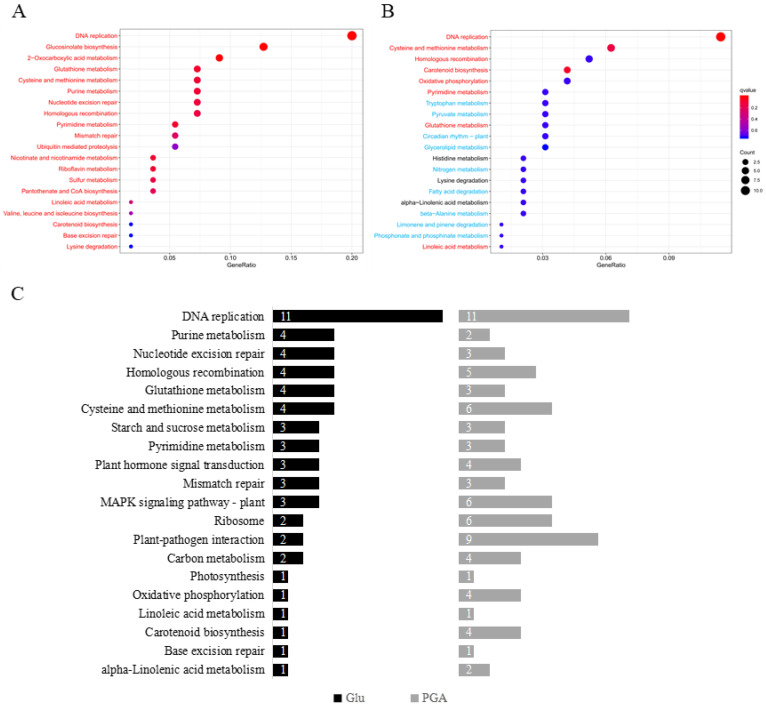
Figure 5.
KEGG classifications of DEGs in different groups. The vertical axis represents the pathway name, and the horizontal axis represents the gene number ratio of significant DEGs to the total genes in a given KEGG pathway. The size of the dots indicated by “Count” represents the number of DEGs in the pathway, and the color of the dots corresponds to the different q-value ranges. (A) Glu relative to Ctrl.; (B) γ-PGA relative to Ctrl.; (C) Glu and γ-PGA commonly expressed relative to Ctrl. Each figure showed top 20 pathways with q-values. Red and blue letters indicate more than 50% up-regulated and down-regulated DEGs out of a total number of DEGs, respectively. Black letter indicates each 50% of up- and down-regulated DEGs.

