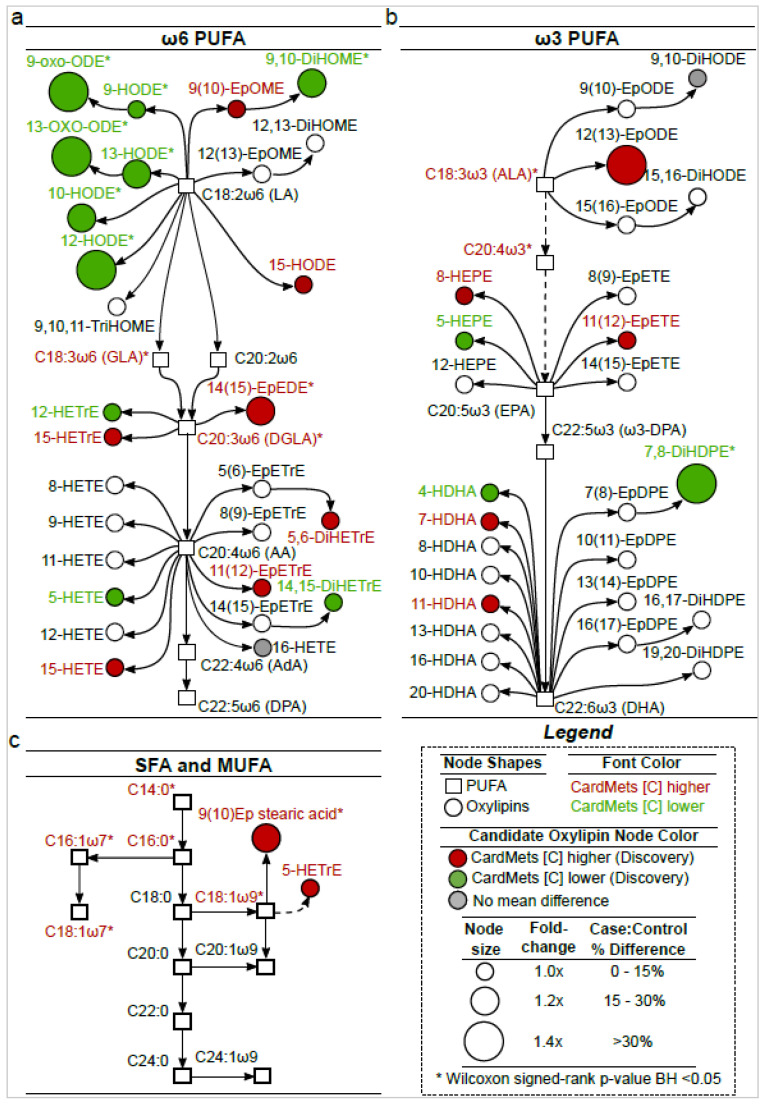
Figure 3.
Biological origin of the candidate oxylipins discriminating participants with MetS. Metabolic pathway showing all oxylipins (n = 54) and the fatty acids (n = 25) (represented by circles and squares, respectively) measured in the Discovery and Replication cross-sectional studies. Pathways of oxylipins biosynthesis derived from omega-6 PUFAs (a), omega-3 PUFAs (b) and SFA/MUFAs (c). The oxylipins selected in the Discovery and Replication studies (candidates oxylipins n = 29) are highlighted in color. Differences in concentration between controls and MetS participants in the Discovery study are highlighted in red (higher concentration in CardMetS group vs. Control), green (lower concentration in CardMetS group vs. Control) or gray (no difference). Dash lines represent indirect pathways including intermediate metabolites. Size of nodes represents the fold change between the two groups. Significant oxylipins from Wilcoxon signed-rank are represented by a star. LA: Linoleic Acid; GLA: γ-Linolenic Acid; DGLA: Dihomo-γ-Linolenic Acid; AA: Arachidonic Acid; AdA: Adrenic Acid; DPA: Docosapentaenoic Acid; ALA: α-Linolenic Acid; EPA: Eicosapentaenoic Acid; DHA: Docosahexaenoic Acid; PUFA: PolyUnsaturated Fatty Acids; SFA: Saturated Fatty Acids; MUFA: MonoUnsaturated Fatty Acids.

