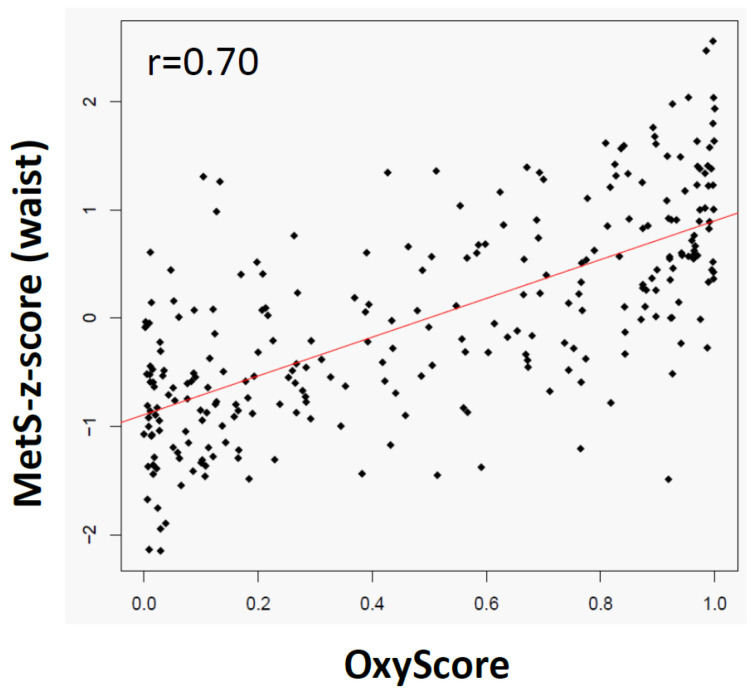
Figure 6.
Relationships between the OxyScore and the Met-z-score. The OxyScore (i.e., probability of having MetS according to the identified and validated oxylipin signature, see Table S2) was computed for all participants in the Discovery cross-sectional study. Spearman correlation was established between the computed OxyScore and the Met-z-score. The Spearman correlation coefficient (r) was highly significant (p < 0.001). The red line represents the linear orientation of the relation.

