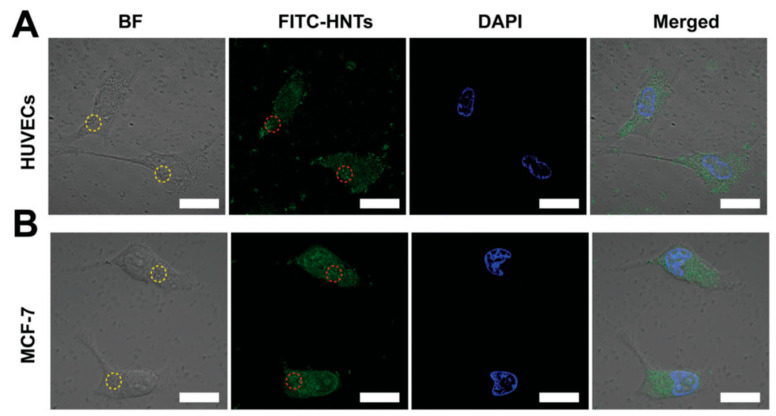
Figure 5.
CLSM images of (A) HUVECs and (B) MCF-7 cells. Cells incubated with FITC-HNTs (50 mg mL−1); FITC-HNTs and cell nucleus are indicated in green and blue, respectively. The circles in the images represent the FITC-HNT aggregates. Scale bar = 20 mm. Adapted from [89].

