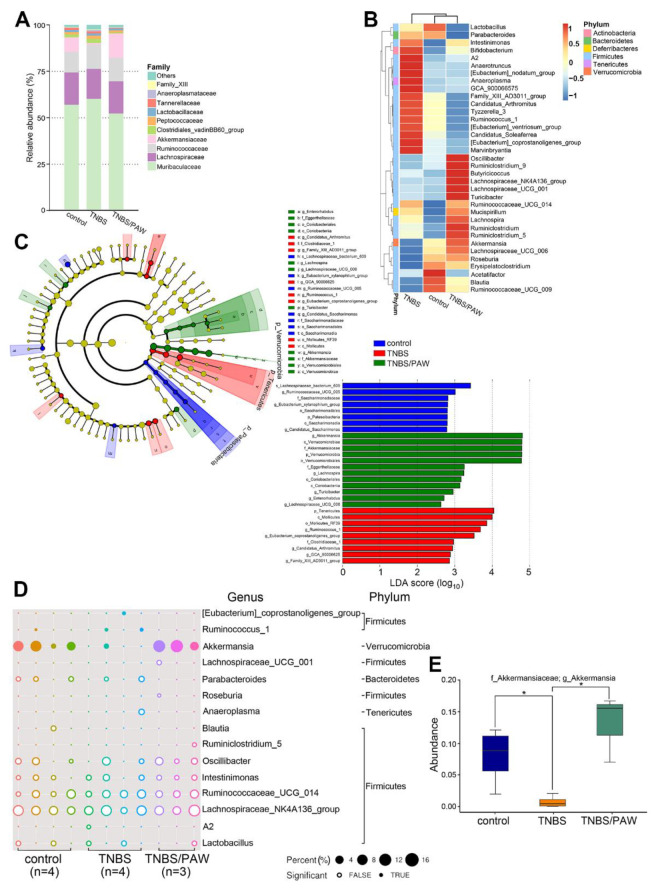
Figure 4.
Different types of gut bacteria due to TNBS treatment and PAW consumption. (A) Histogram showing the relative levels of family across the three groups. (B) Heat map displaying the relative abundances of genus across the three groups. (C) Cladogram of the phylotypes that differed between the groups displayed according to effect size. Key contributors to the structural segregation of different groups were identified using LEfSe. Significant bacterial taxonomic groups are labeled, with the genus (g), family (f), species (s), or order (o). LDA scores of enriched bacterial taxa (LDA > 2 of LEfSe). Significantly enriched bacterial taxa from different groups were clustered. Differences represented by the color of the most abundant class were noted as: blue, control group; red, mice with TNBS treatment; green, mice with TNBS treatment and PAW consumption. LDA, linear discriminate analysis. (D) Bubble chart showing the relative abundance of amplicon sequence variants between genera (y-axis) in relation to the eleven different samples (x-axis). (E) MetagenomeSeq analyzing the relative abundance of the target Akkermansia genus among groups. The thick line in the boxplot represented the median number of reads for the cluster. * p < 0.05.

