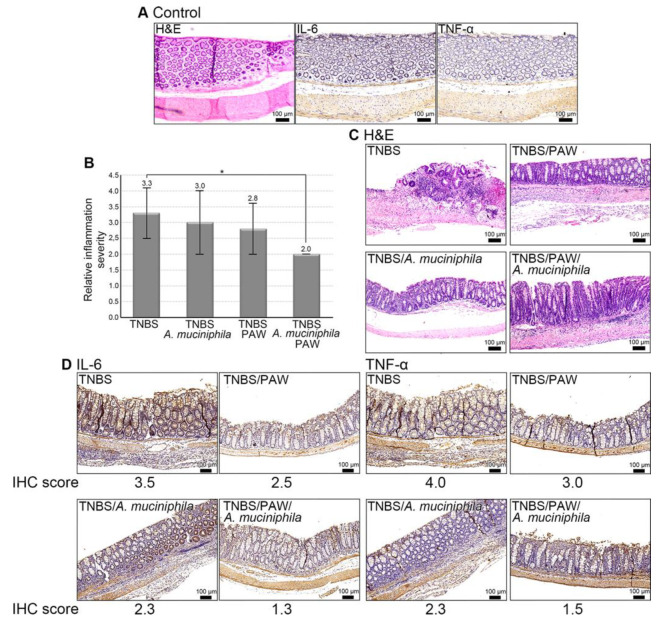
Figure 7.
Change of inflammatory response in the presence of A. muciniphila. (A) Histological change and signal intensity of IL-6 and TNF-α in the control mice. Control mice, mice without PAW consumption and A. muciniphila treatment. (B) Histological score of inflammation in different groups. Score for inflammation severity: 1, none; 2, mild; 3, moderate; 4, severe. (C) Representative images of H&E-stained colon sections for inflammation severity. (D) Representative images of IHC staining for IL-6 and TNF-α in mouse colon. IHC score for the percentage of positively stained cells: 1, 0–25%; 2, 26–50%; 3, 51–75%; 4, 76–100%. TNBS, 2,4,6-trinitrobenzene sulfonic acid; PAW, plasmon-activated water; H&E, hematoxylin, and eosin; IHC, immunohistochemistry. Scale bars, 100 μm. * p < 0.05.

