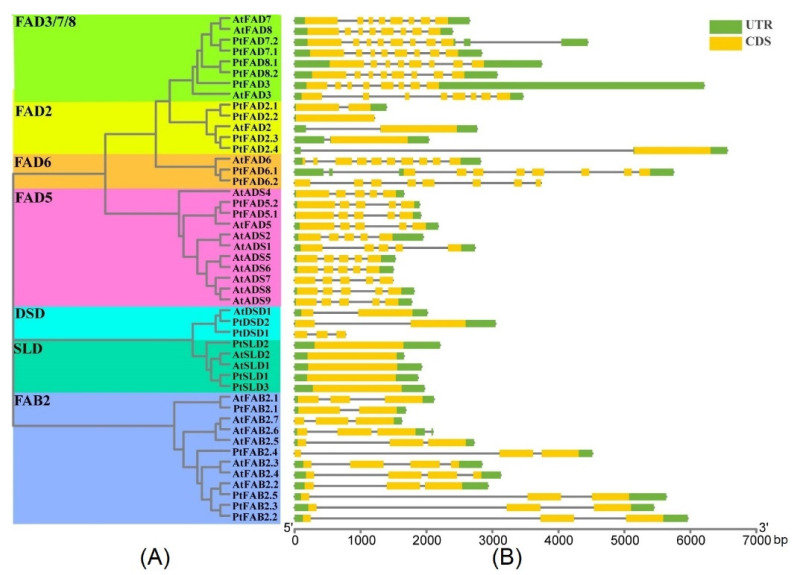
Figure 4.
Exon–intron distributions of PtFAD and AtFAD members. (A) The unrooted phylogenetic tree was shown, constructed using MEGA7.0 set to the neighbor-joining (NJ) method, and different clades were marked with different color backgrounds. (B) Exons, introns, and untranslated regions (UTR) were indicated by yellow rectangles, grey lines, and green rectangles, respectively. PtFAD and AtFAD members were clustered based on a phylogenetic tree. Base pair: bp.

