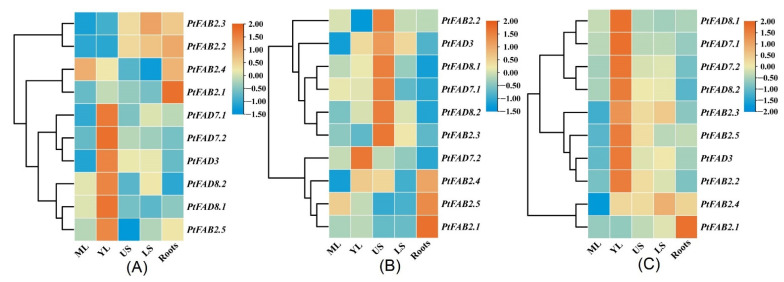
Figure 7.
The expression pattern of PtFAD genes in various tissues and organs. The RT-qPCR was applied to investigate PtFAD expression patterns in P. trichocarpa (A), ‘Nanlin 895’ (Populus × euramericana cv.) (B), and ‘Shanxinyang’ (P. davidiana × P. bolleana) (C) tissues. The heatmap was generated using TBtools software. The color scale indicated the normalized data, where dark orange represented a high expression level, blue represented a low expression level, and orange represented a medium level. Mature leaves: ML; young leaves: YL; the upper region of stems: US; the lower region of stems: LS.

