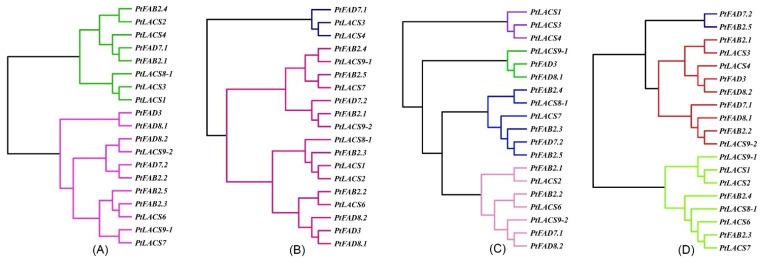
Figure 9.
The cluster dendrogram of PtFAD and PtLACS expression patterns under ABA (A), H2O2 (B), NaCl (C), and PEG6000 (D). The data were normalized to PtActin (XM-006370951) expression level. Each PtFAD and PtLACS expression level was calculated based on the corresponding gene mRNA level in poplar without treatments.

