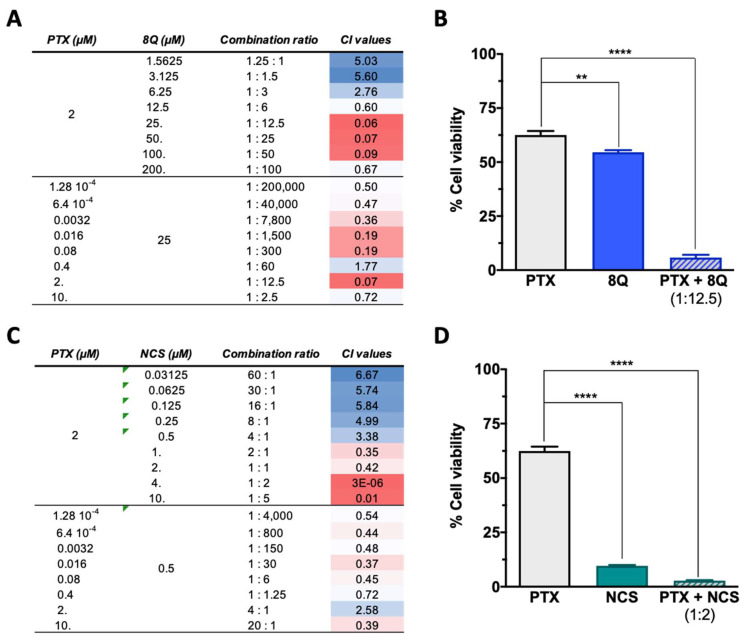
Figure 4.
Effect of the combination of 8Q and NCS with PTX on the cell viability of MDA-MB-231 cells. (A) Combination index (CI) of different PTX to 8Q drug ratios, shown as heat maps (CI > 1 indicating antagonism in blue, CI < 1 showing synergism in red). Studies were done fixing the PTX concentration first at its IC50 value (2 µM) and changing the 8Q concentration (top values), fixing the 8Q concentration at its IC50 value (25 µM) and varying the PTX concentration (bottom values). (B) Viability of MDA-MB-231 cells treated with PTX, 8Q or the 1:12.5 PTX:8Q ratio. (C) CI of different PTX to NCS ratios, again fixing first the PTX at its IC50 value (2 µM) and changing the NCS concentration (IC50 value 0.5 µM) and vice versa (lower part of the table). (D) Viability of MDA-MB-231 cells treated with PTX, NCS or the 1:2 PTX:NCS ratio. Data are represented as the mean ± SEM of three independent experiments (** p < 0.01, **** p < 0.0001).

