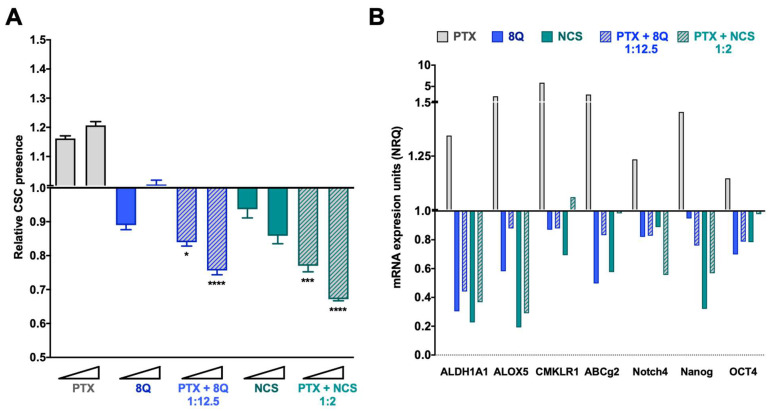
Figure 5.
Anti-CSC activity of 8Q and NCS in combination with PTX in the MDA-MB-231 fluorescent CSC model. (A) Relative CSC-tdTomato+ presence determined by flow cytometry and referred to control condition. Values below than, equal to or above 1 indicate reduction, maintenance or increase of CSC-tdTomato+ cells within population, respectively. Data are represented as the mean ± SEM of three independent experiments. Statistic t-test analyses were performed to compare drug combinations with single anti-CSC drug treatments at the corresponding equivalent drug dose (* p < 0.05, *** p < 0.001, **** p < 0.0001). (B) Changes in the stem cell gene expression profile determined by quantitative RT-PCR. Results are expressed as normalized relative quantities (NRQ) and referred to as control conditions. Concentrations tested for drugs were 0.5 and 1 μM for PTX, 6.25 and 12.5 μM for 8Q, 1 and 2 μM for NCS and the corresponding combined ratios.

