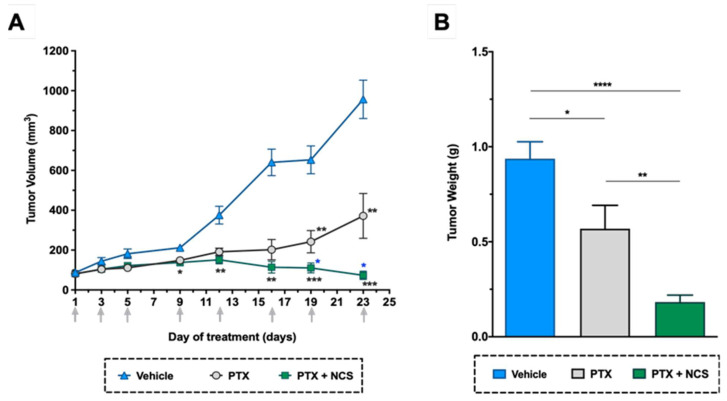
Figure 9.
In vivo efficacy of PTX in combination with NCS in mice with orthotopic MDA-MB-231 tumors. (A) Tumor volume measurements in the study groups during treatment. (B) Tumor weights at the end of the experiment. Arrows indicate treatment points. The results are represented as the mean ± SEM in both graphs (animals/group ≥ 6). Statistic t-test analyses of combined treatment were performed in comparison with vehicle (black) as well as with PTX single treatment (blue). In all cases, * p < 0.05, ** p < 0.01, *** p < 0.001 and **** p < 0.0001.

