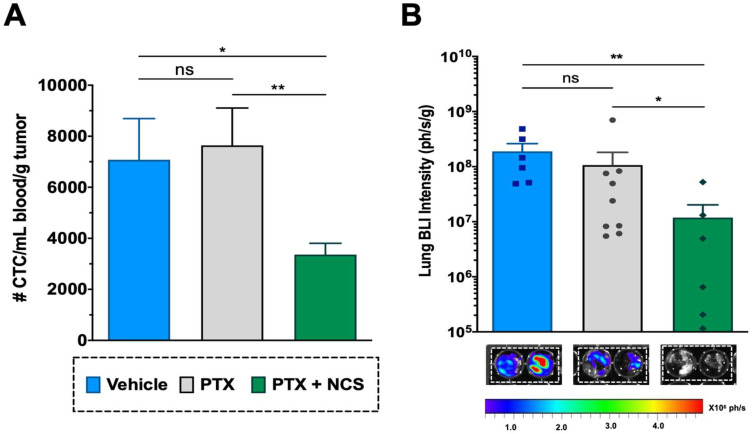
Figure 10.
Effect of the PTX-NCS combination on CTC and lung metastasis. (A) Quantification of plasma circulating tumor cells (CTCs) isolated from the bloodstream of MDA-MB-231 tumor-bearing mice and further analyzed by flow cytometry. The results are represented as the number of CTC events (mean ± SEM) per mL of blood collected and further normalized per gram of tumor (n ≥ 6). A statistic t-test analysis was performed to compare the results between the study groups. (B) Quantification of BLI signal intensity from mice lungs of all three study groups. Results are expressed as the mean ± SEM of the BLI signal (ph/s) per gram of lung tissue (n ≥ 6). Statistical Mann–Whitney analysis was performed comparing the results between the study groups. Representative BLI images of excised mice lungs from all three study groups at endpoint necropsy are also shown. Bioluminescent signals were analyzed by ex vivo imaging using the IVIS Spectrum and further quantified using Living Image® 4.5.2 software. Statistical significance is shown as ns p > 0.05, * p < 0.05, and ** p < 0.01.

