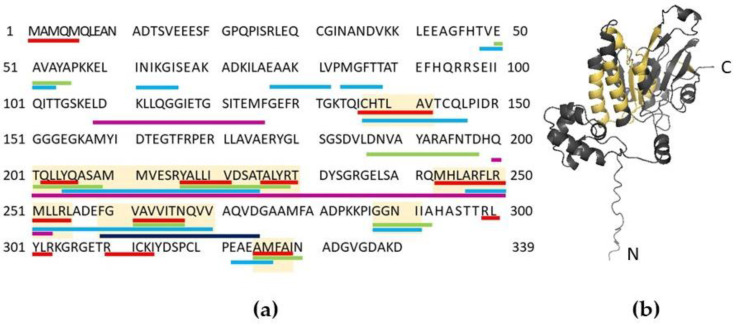
Figure 3.
Representation of the amyloidogenic regions in RAD51. (a) Analysis performed by FoldAmyloid (red), Waltz (green), AGGRESCAN (light blue), ArchCandy (magenta) and PASTA 2.0 (dark blue). Light yellow boxes represent amyloidogenic regions predicted by at least two algorithms that are ≥5 a.a. long. (b) The 3D model of the RAD51 protein was generated using AlphaFold2 [50] and visualized with PyMol (pymol.org). The amyloidogenic regions predicted by at least two algorithms (≥5 a.a. long) are shown in yellow.

