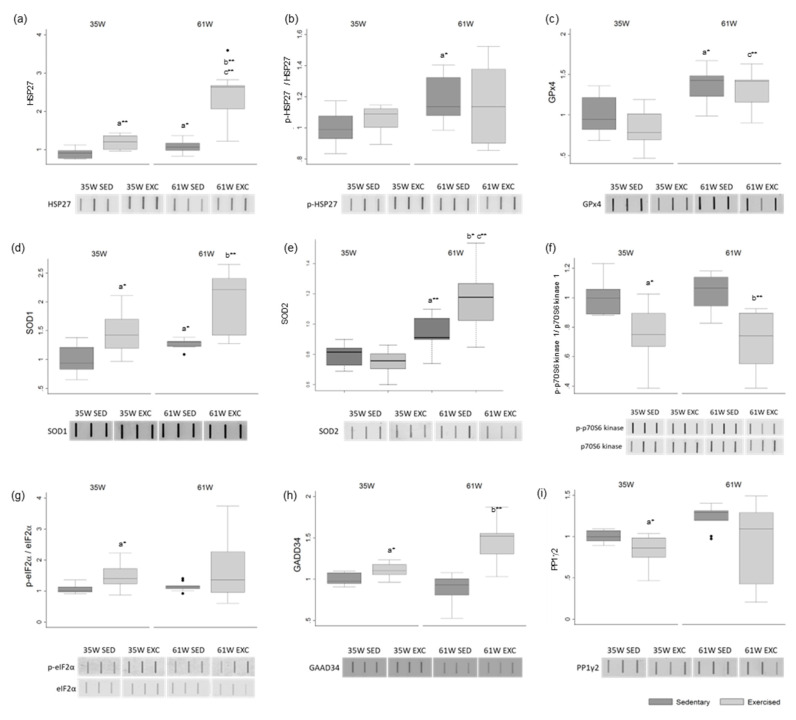
Figure 3.
Box and whisker plots show the effect of exercise training and age on the protein levels of (a) HSP27, (b) p-HSP27, (c) GPx4, (d) SOD1, (e) SOD2, (f) p-RPS6KB1, (g) p-eIF2a, (h) GADD34 and (i) PP1g2. Ponceau S. was used as the protein-loading control. Phosphorylation-specific signals were normalized against the total level of the total protein. The results are represented in fold variation to control. The horizontal line displays the median, the box edges show the 25th and 75th percentiles and the whiskers show the smallest and highest value within 1.5 box lengths from the box (n = 8 for 35 W Sedentary; n = 9 for 35 W Exercised, 61 W Sedentary and 61 W Exercised). * p < 0.05; ** p < 0.01. a—Significantly different from 35 W Sedentary; b—significantly different from 61 W Sedentary; c—significantly different from 35 W Exercised.

