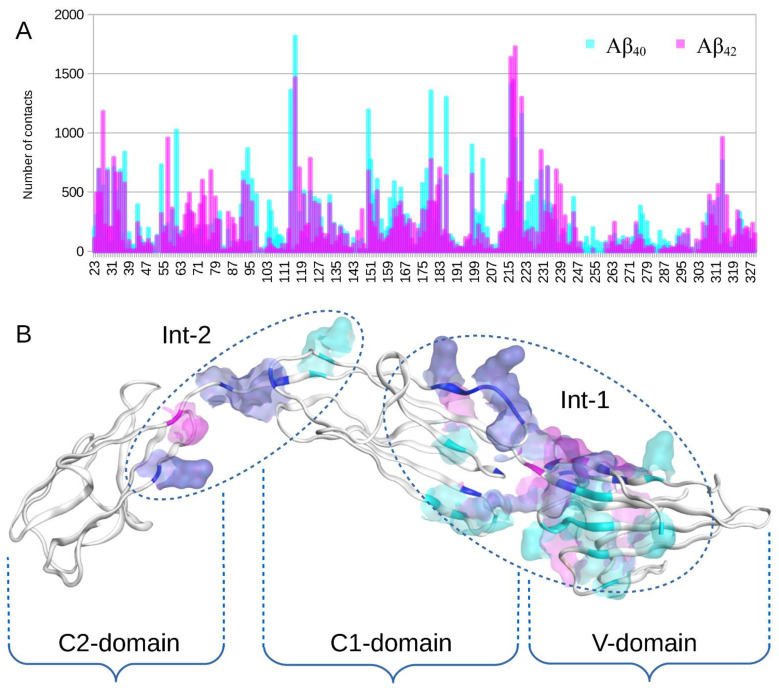
Figure 1.
Global docking results of Aβ42 and Aβ40 peptides to RAGE protein performed with servers LzerD, ATTRACT, PatchDock, ClusPro, Hdock and Zdock and analyzed with QASDOM server. The 30 best complexes from each server have been used for analysis, and 10 complexes from Zdock. (A) Superposition of the docking contact frequency histogram for RAGE residues over all 160 complexes with Aβ42 (cyan) and Aβ40 (magenta). (B) Interacting residues highlighted in the RAGE structure according to the global docking results. Residues interacting only with Aβ42 are highlighted with magenta. Residues interacting only with Aβ40 are highlighted with cyan. Residues interacting with both isoforms are highlighted with blue. RAGE domains are indicated with curly braces. In (B), two independent extended interaction regions localized far from each other can be distinguished. They are marked with dotted ovals and represent Interface 1 (Int-1) and Interface 2 (Int-2).

