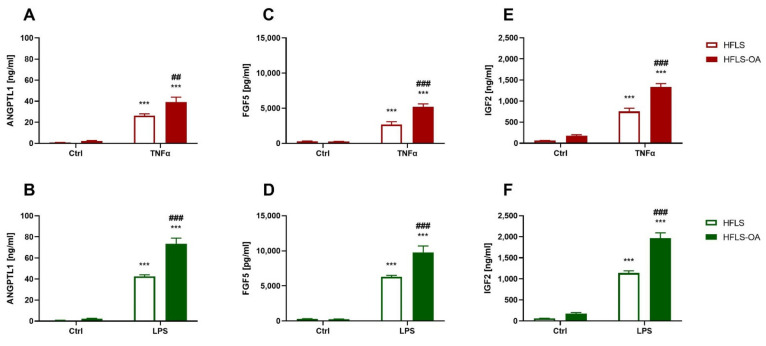
Figure 3.
Growth factor secretion levels by HFLS and HFLS-OA stimulated with TNFα or LPS measured using the ELISA method. Secretion of growth factors measured in media using the ELISA method. Cells were stimulated for 24 h with 10 ng/mL of TNFα (A,C,E) or LPS (B,D,F). Afterward, the media were collected, and ANGPTL1 (A,B), FGF5 (C,D), and IGF2 (E,F) levels were determined. Data are presented as pg or ng/mL ± SEM and analyzed with two-way ANOVA followed by Tukey’s post hoc test. *** p < 0.001 vs. control group. ## 0.01 > p > 0.001; ### p < 0.001 HFLS vs. HFLS-OA stimulated groups. HFLS, human fibroblast-like synoviocytes; HFLS-OA, osteoarthritic human fibroblast-like synoviocytes; TNFα, tumor necrosis factor alpha; LPS, lipopolysaccharide; ELISA, enzyme linked immunosorbent assay; ANGPTL1, angiopoietin like 1; FGF5, fibroblast growth factor 5; IGF2, insulin growth factor 2.

