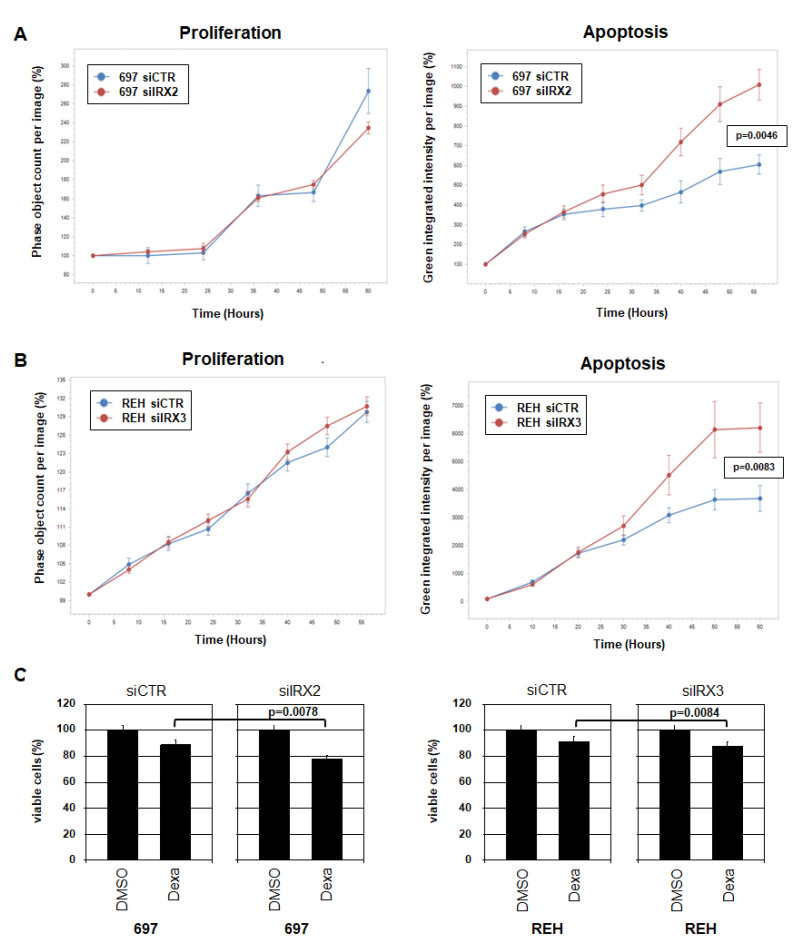
Figure 7.
Oncogenic activities of IRX2 and IRX3 in BCP-ALL. (A) Live-cell imaging analysis of 697 cells treated for siRNA-mediated knockdown of IRX2. (B) Live-cell imaging analysis of REH cells treated for siRNA-mediated knockdown of IRX3. Standard deviations are shown as bars. Indicated p-values refer to terminal time points of treated versus control cells. (C) MTT assay analysis of 697 (left) and REH (right) treated for IRX knockdown and with 1 µM dexamethasone (Dexa) for 24 h, showing the percentage of viable cells. Standard deviations and p-values are indicated (t-test).

