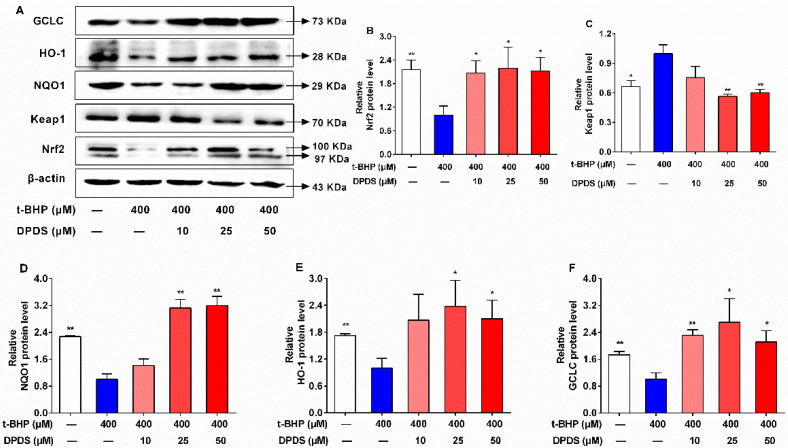
Figure 3.
DPDS activated the Nrf2/Keap1 signaling pathway in t-BHP-stimulated HBZY-1 cells. HBZY-1 cells were exposed to t-BHP (400 μM) alone or in combination with DPDS (10, 25 or 50 μM) for 24 h. (A) Representative protein band of Nrf2, NQO1, HO-1 and GCLC. (B) The relevant quantitative data of Nrf2 expressed as fold of t-BHP group. (C) The relevant quantitative data of Keap1 expressed as fold of t-BHP group. (D) The relevant quantitative data of NQO1 expressed as fold of t-BHP group. (E) The relevant quantitative data of HO-1 expressed as fold of t-BHP group. (F) The relevant quantitative data of GCLC expressed as fold of t-BHP group. Values are presented as means ± SEM, n = 4. * p < 0.05, ** p < 0.01 versus the 400 μM t-BHP group.

