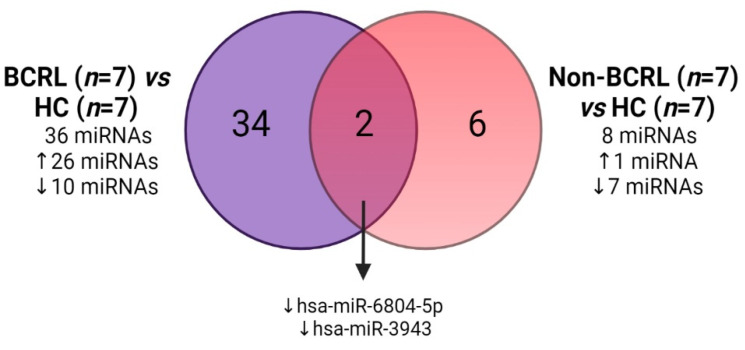
Figure 3.
Venn diagram representing overlapping miRNA expression between BCRL vs. HCs and non-BCRL vs. HCs. A total of 36 miRNAs were differentially expressed in the BCRL group (purple and left-hand circle) and 8 miRNAs were differentially expressed in the non-BCRL vs. HCs (8 miRNAs, red and right-hand circle). The direction of the regulation is represented with an upward pointing arrow (upregulated) and a downward pointing arrow (downregulated).

