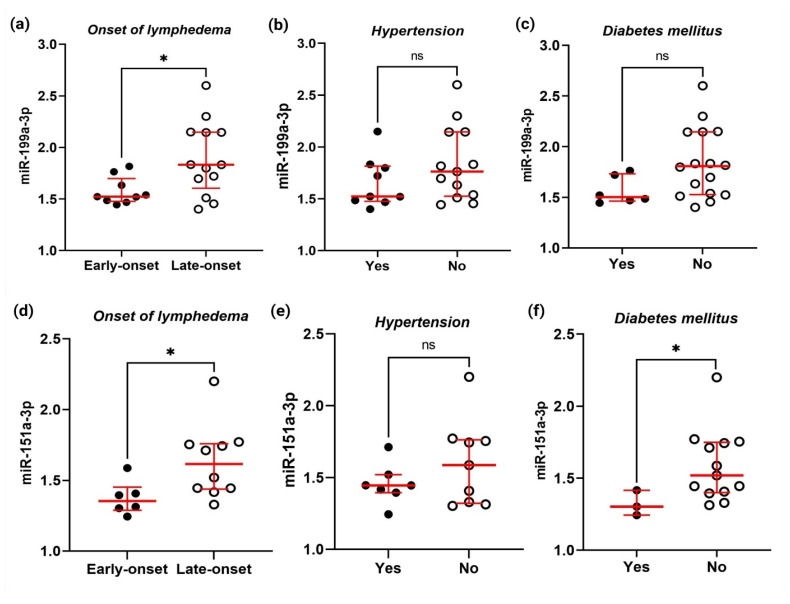
Figure 5.
The relative expression of miR-199a-3p and miR-151a-3p in the BCRL group (n = 23) stratified by the onset of lymphedema, hypertension, and diabetes mellitus status. Relative expression of miR-199a-3 by qPCR analyzed according to (a) onset of lymphedema, (b) hypertension, and (c) diabetes mellitus status. Relative expression of miR-151a-3p stratified by (d) onset of lymphedema, (e) hypertension, and (f) diabetes mellitus. Samples were measured in triplicate and results are shown as a dot plot of the relative normalized expression of the miRNA of interest (2−∆∆Ct). * p-values were calculated by Mann–Whitney test (p < 0.05), with ns denoting a non-significant difference. The horizontal bars represent pairwise comparison between respective variables and dichotomous outcomes, blue lines represent the median and error bars indicate the IQR of each group.

