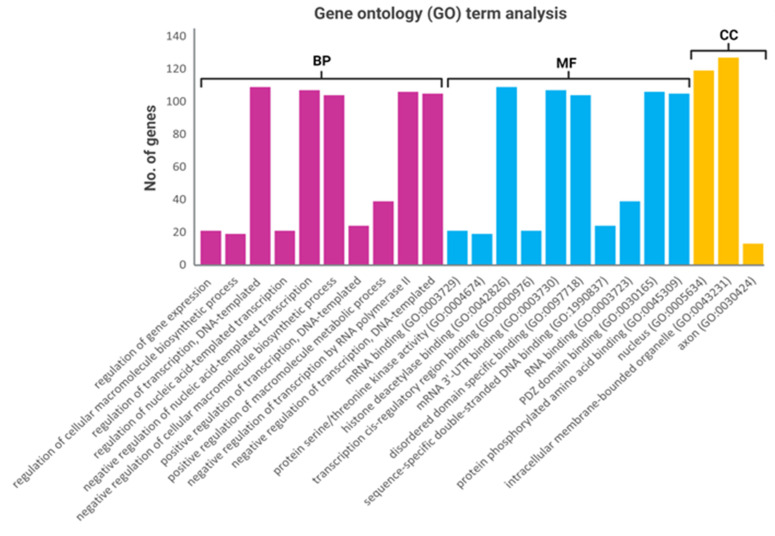
Figure 6.
GO analysis of predicted target genes regulated by miR-151a-3p and miR-199a-3p. Data are presented as the number of genes (Y-axis) involved in each of the domains. The X-axis represents GO terms of each biological process (BP, purple bar), molecular function (MF, blue bar), and cellular component (CC, yellow bar) (X-axis) with FDR adjusted p-value < 0.05 (Benjamini–Hochberg).

