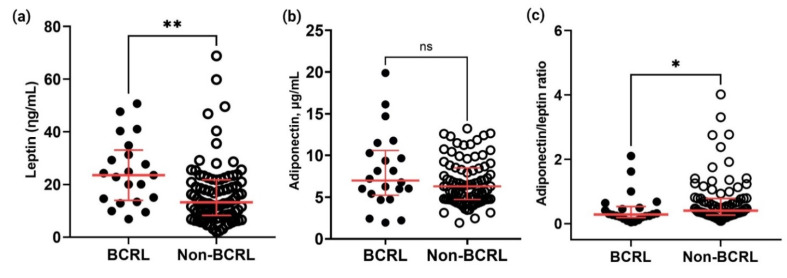
Figure 7.
Comparison of the circulating leptin, adiponectin, and adiponectin/leptin ratio between the BCRL (n = 22) and non-BCRL group (n = 86). The levels of (a) leptin and (b) adiponectin were quantified by ELISA, whereas the (c) adiponectin/leptin ratio was calculated using a formula ((Adiponectin (μg/mL))/(Leptin (ηg/mL))). The horizontal black lines indicate a comparison line between the two groups and significant values were calculated by Mann–Whitney U test, p < 0.05. Asterisks in the figures represent statistical significance (* p < 0.05 and ** p < 0.001) and ns indicates non-significance. Samples were run in triplicate and the precision (CV%) of intra-assays were maintained between 10–15%. All data are presented as the median and error bars represent IQR.

