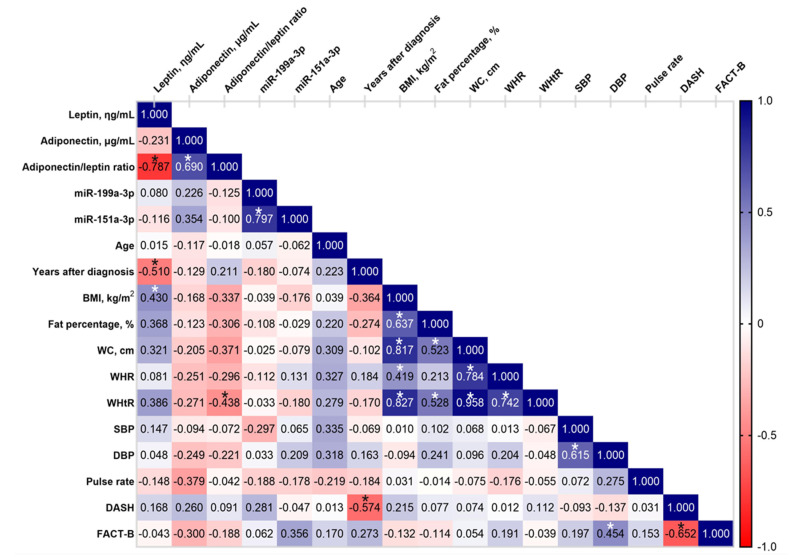
Figure 8.
Correlation matrix of leptin, adiponectin level, and adiponectin/leptin ratio with miR-199a-3p, miR-151a-3p, and relevant variables of the study subjects in the BCRL group. As presented by the correlation range (right-hand bar), the darker blue color indicates a stronger positive correlation, the darker red color indicates a stronger negative correlation, and the white color indicates no correlation. The Pearson’s correlation coefficient (r) values for each correlation are shown in the rectangles and the asterisks represent a significant p value, p < 0.05, between the pairwise correlation. BMI body mass index, WC waist circumference; WHR waist-to-hip ratio; WHtR waist-to-height ratio; SBP systolic blood pressure; DBP diastolic blood pressure; DASH Disabilities of Arm, Shoulder, and Hand; FACT-B Functional Assessment of Cancer Therapy–Breast.

