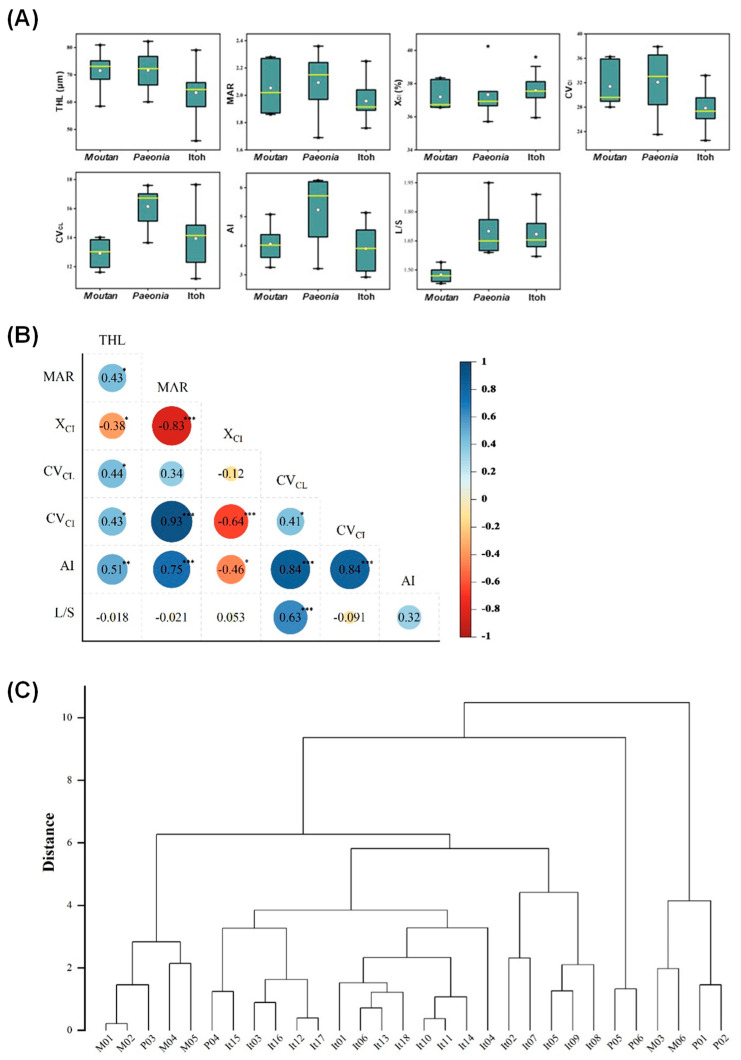
Figure 4.
Comparison of karyological diversity among different peony species or varieties in sect. Moutan, sect. Paeonia, and Itoh hybrids. (A) The range and distribution of seven chromosomal parameters. Horizontal lines and hollow circles in the box represent median and mean values, respectively [50% of data are within the box, and 99% are within the bar (± SD)]. The asterisks represent data outside the box. (B) Pearson correlation analysis of seven chromosomal parameters shown in (A); the asterisks *, **, and *** indicate a significant correlation at the 0.05, 0.01, and 0.001 levels, respectively. (C) Hierarchical clustering analysis of the 30 peonies based on the seven chromosomal parameters shown in (A). The names of 30 peonies and categories of seven parameters are shown in Table 1 and Table 2.

