Figure 1.
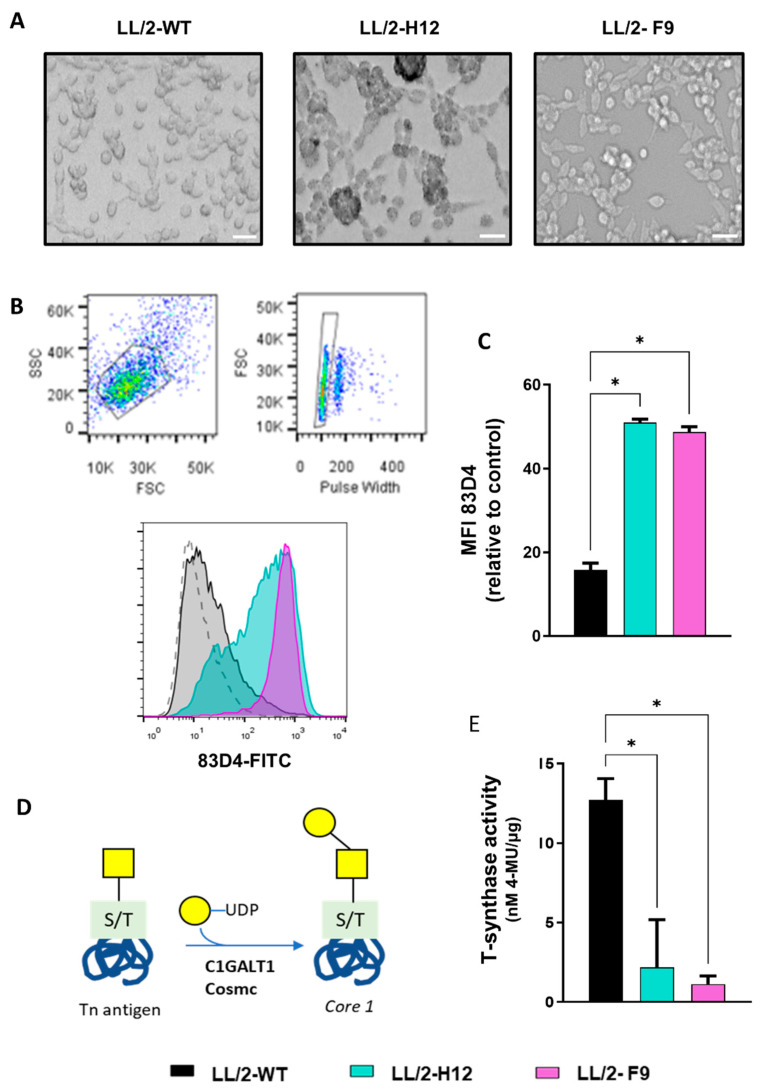
Generation of Tn+ LL/2 cells. (A) Morphology of LL/2 WT and Tn+ cells (LL/2- Tn+-H12 and LL/2-Tn+-F9). The white bar represents 20 µm. (B) Expression of Tn antigen by flow cytometry in LL/2 tumor cells. Representing gating strategy and histogram of 83D4 staining on LL/2-WT (black), LL/2-Tn+-H12 (green), and LL/2-Tn+-F9 (purple) cells. The dotted line represents the non-stained negative control. (C) Median fluorescence intensity (MFI) of 83D4 staining normalized to negative control incubating cells only with secondary antibody FITC-conjugated (dotted histogram). (D) Representation of the Tn elongation to core 1 by the core 1 synthase (C1GALT1, T-synthase) enzyme together with the Cosmc chaperone. (E) T-synthase activity was measured as nM of 4-Methylumbelliferone (4-MU) per µg of total protein. Asterisks represent significant differences (p < 0.05).

