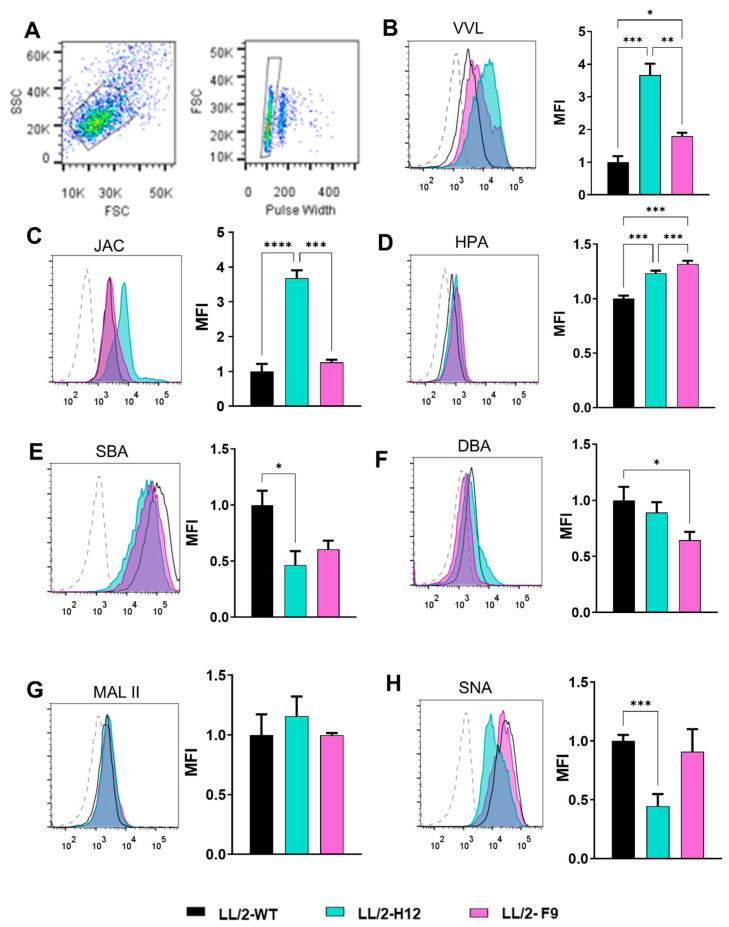
Figure 3.
Surface glycan motifs of Tn-bearing LL/2 and WT cells determined by lectin recognition. LL/2 cells were stained with plant lectins and analyzed by flow cytometry. (A) Representative gating strategy. B-H) Histogram and median fluorescence intensity (MFI) are shown for LL/2-Tn+-H12 (green) and LL/2-Tn+-F9 (pink) relative to WT LL/2 cells for VVL (B), JAC (C), HPA (D), SBA (E), DBA (F), MAL II (G) and SNA (H). Dotted histograms represent the control condition consisting of cells incubated only in the presence of streptavidin-FITC. The specificity of lectins is shown in Supplementary Table S1. Asterisks represent significant differences (* p < 0.05, ** p < 0.01, *** p < 0.001, **** p < 0.00001).

