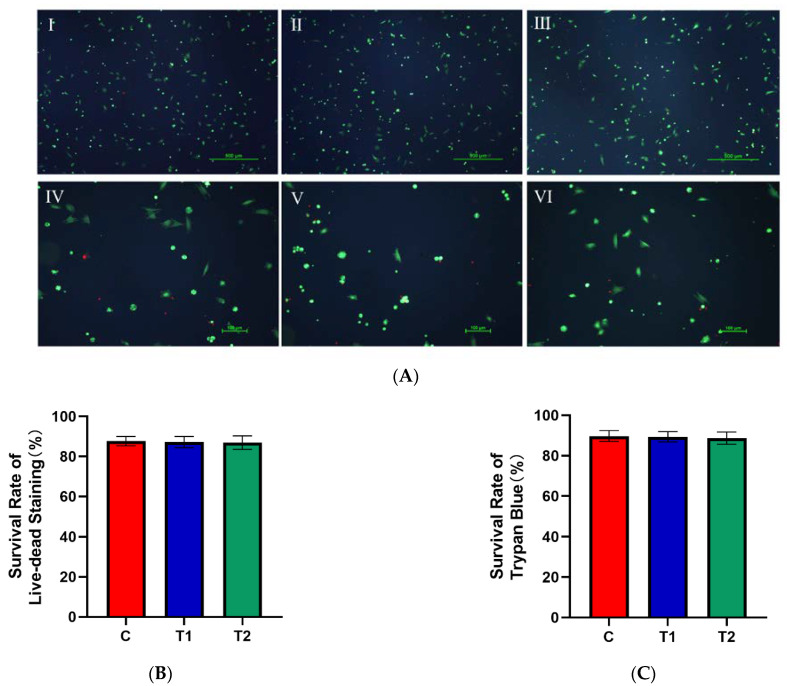
Figure 4.
Effects of new cryopreservation strategy on the cell survival rate. (A) Live–dead staining results of dental pulp cells. Ⅰ: C group (×40); Ⅱ: T1 group (×40); Ⅲ: T2 group (×40); Ⅳ: C group (×100); Ⅴ: T1 group (×100); Ⅵ: T2 group (×100). (B) The survival rate of live–dead staining in each group. (C) The survival rate of Trypan Blue staining in each group.

