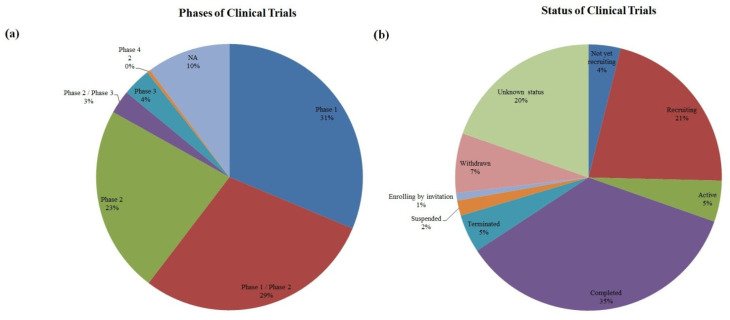
Figure 2.
This figure provides a graphical representation of phases and statuses in 492 selected trials. The majority of trials were completed (35%), 21% of trials were recruiting while only 5% were active. We also detected a high percentage of trials with unknown status—20%. 7% of all trials were withdrawn. Phase 1 and phase 2 trials were predominant accounting for 83%. Only 4% of trials were in phase 3 and only 2 trials reached phase 4. (a) Represents phases of the clinical trials and (b) Represents statuses of the clinical trials, NA—not applicable.

