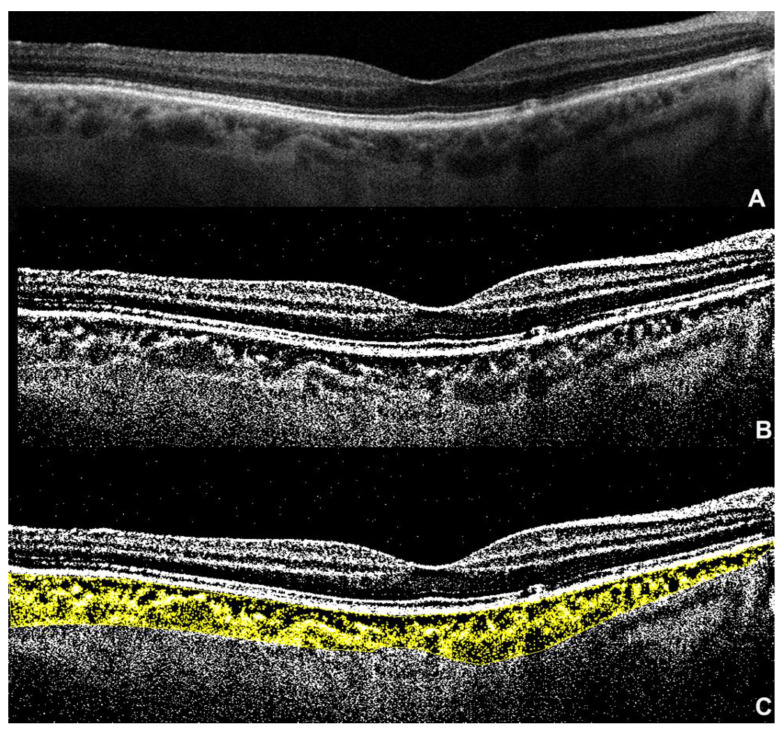
Figure 2.
Choroidal vascularity index (CVI): (A) spectral-domain optical coherence tomography (SD-OCT) subfoveal B-scan; (B) the same image after binarization using Niblack’s autolocal threshold technique; (C) the binarized image after applying color threshold into a polygonal selection traced between the retinal pigment epithelium and the choroid–scleral junction; the dark pixels represent the luminal areas, while the remaining light pixels represent the stroma.

