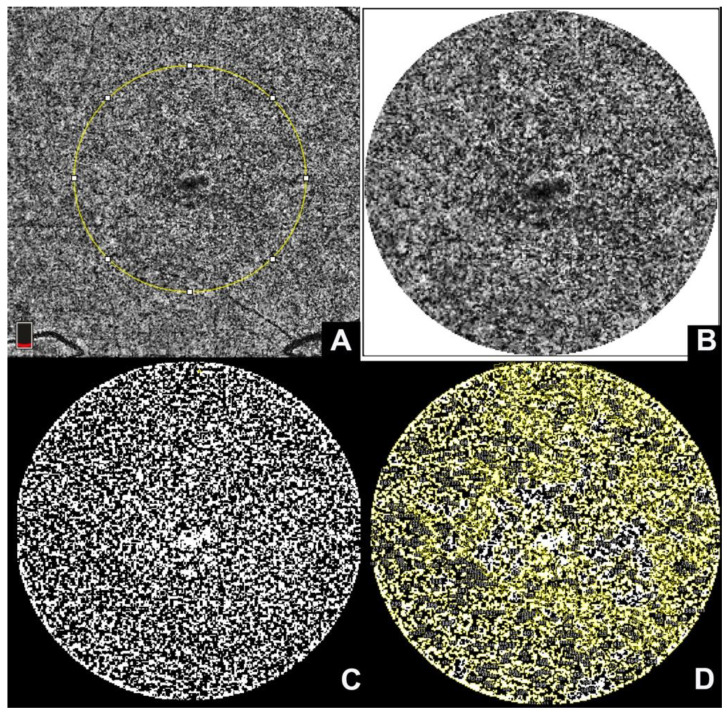
Figure 3.
Choriocapillaris flow voids: (A) a choriocapillaris slab obtained through optical coherence tomography angiography. The yellow circle represents a region of interest chosen for processing. (B) The region of interest is then cropped using a circular selection of 1 mm and (C) imported into Fiji software for binarization using autolocal threshold with Phansalkar method; (D) the binarized slab is analyzed using the “Analyze Particles” tool that automatically counts the flow deficits.

