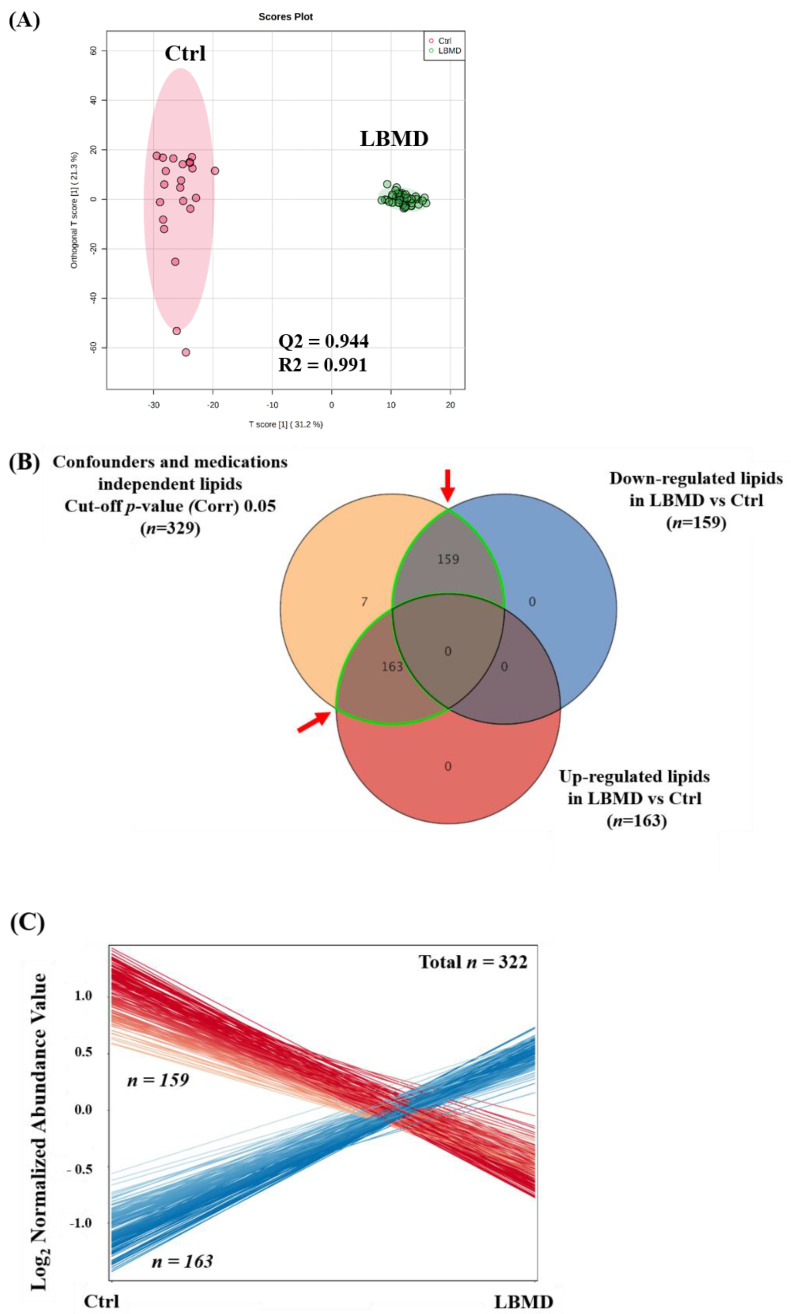
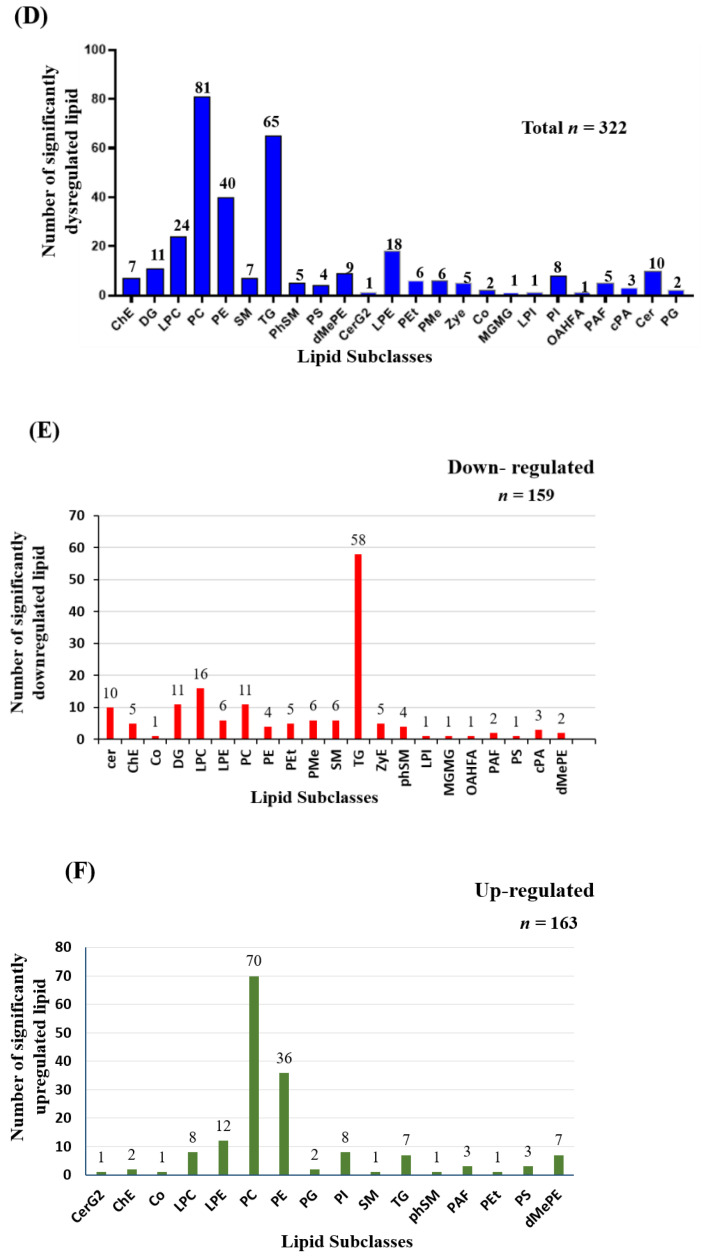
Figure 2.
Lipidomics profiling between healthy control (Ctrl) and patients with low bone mineral density (LBMD). (A) An Orthogonal Partial Least Squares-Discriminant Analysis (OPLS-DA) module plot illustrates sample clustering and separation between Ctrl versus LBMD groups based on the lipidomics profile, where the robustness of the models was evaluated by the fitness of the model (R2Y = 0.944) and predictive ability (Q2 = 0.991) values in a larger dataset (n = 1000). (B) A Venn diagram shows that 322 lipid molecules were dysregulated in LBMD compared with Ctrl; fold change cut-off 2, FDRp-value 0.05. (C) The expression of the dysregulated lipid molecules (n = 322) was demonstrated, where 163 were upregulated and 159 down-regulated in LBMD compared with Ctrl. (D) A bar graph shows the dysregulated lipid molecules (n = 322) on subclasses. (E,F) Bar graphs show the distribution of the down-regulated (n = 159) in (E) and up-regulated (n = 159) in (F) lipid molecules in LBMD compared with Ctrl.


