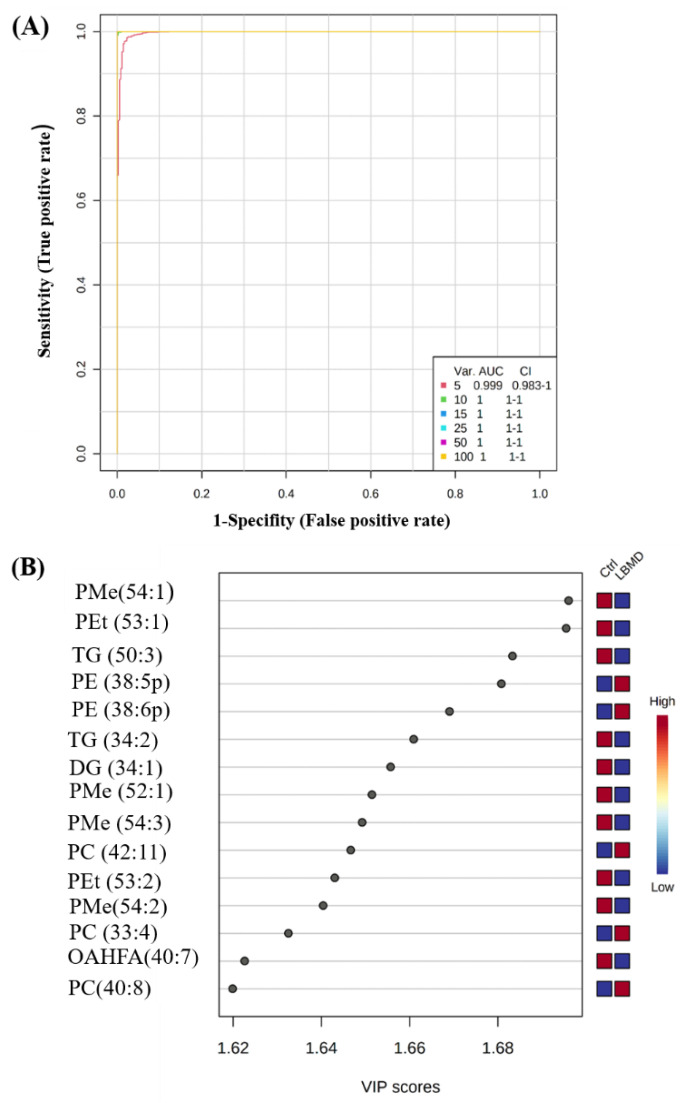
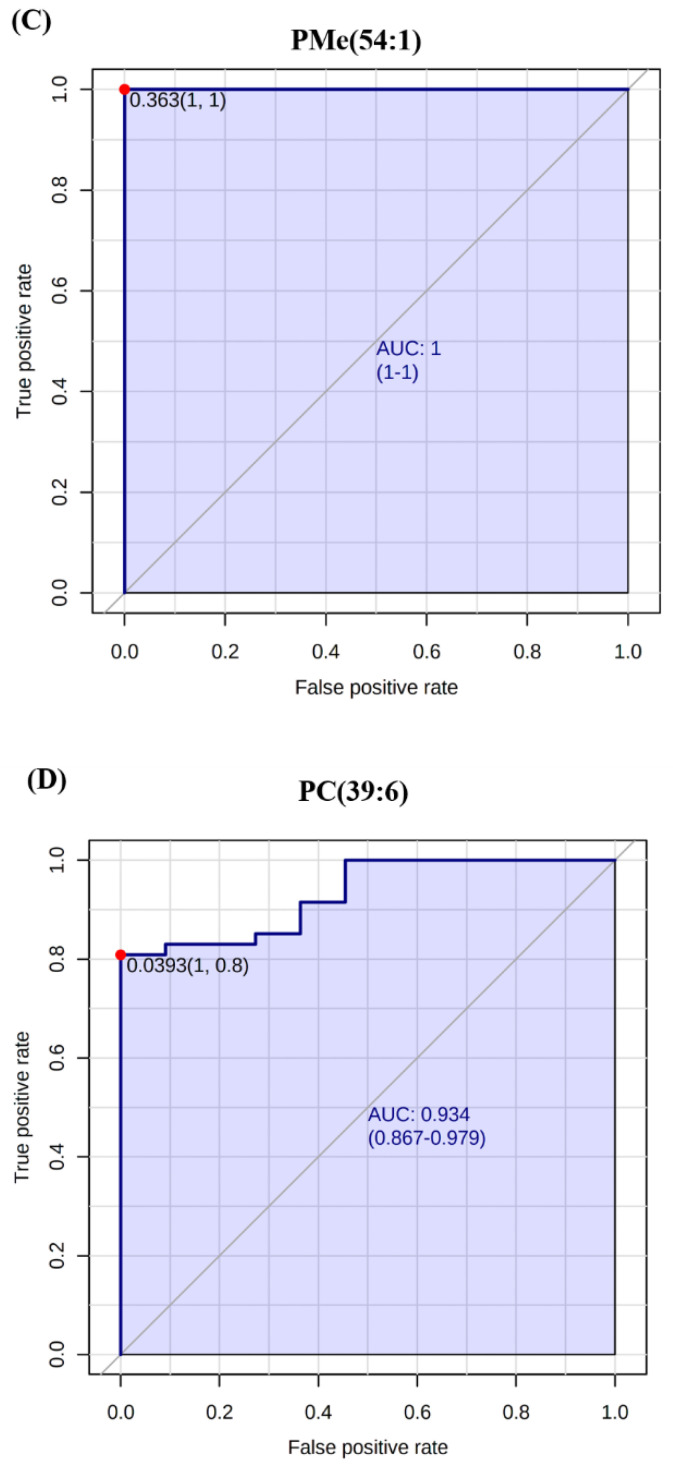
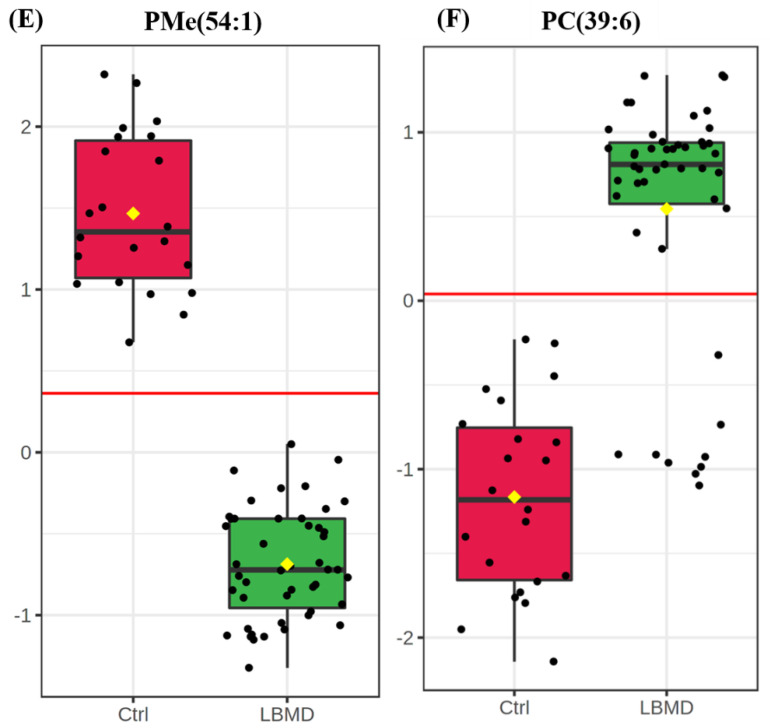
Figure 3.
Lipidomic profiling and biomarker evaluation between healthy Ctrl and LBMD patients. (A) An exploratory ROC curve generated by the OPLS-DA model, with the area under the curve (AUC) values calculated from the combination of 5, 10, 15, 25, 50, and 100 lipid molecules. (B) VIP plot showing the top 15 positively identified lipid molecules. (C,D) Representative ROC curves for two significantly dysregulated lipid molecules (PMe (54:1), AUC = 1, and Phosphatidylcholines (PC (39:6), AUC = 0.934)). (E,F) Boxplots for representative significantly dysregulated lipids in LBMD compared with Ctrl, PMe (54:1) is significantly down-regulated in LBMD, p-value = 4.54E−29, where PC (39:6) is significantly up-regulated in LBMD, p-value = 1.59E−13. (PMe: phosphatidylmethanol, PC: phosphatidylcholine.)


