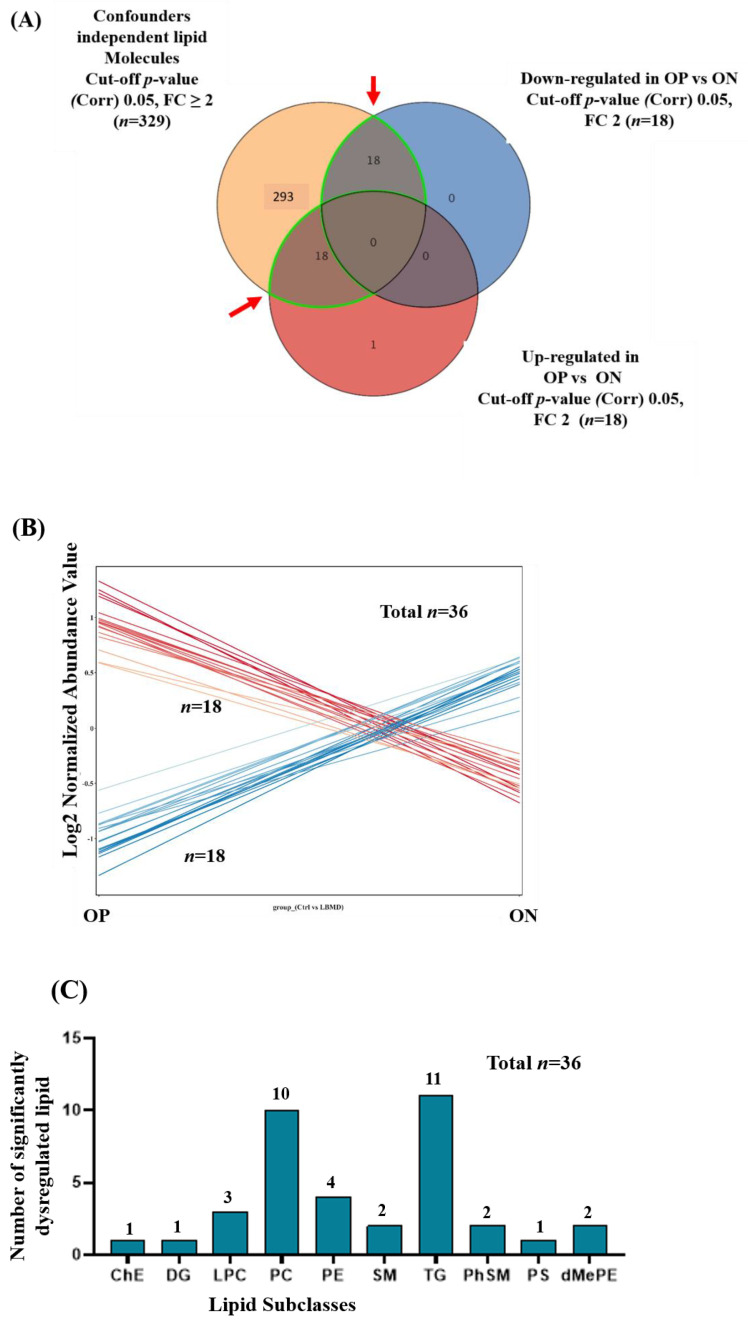
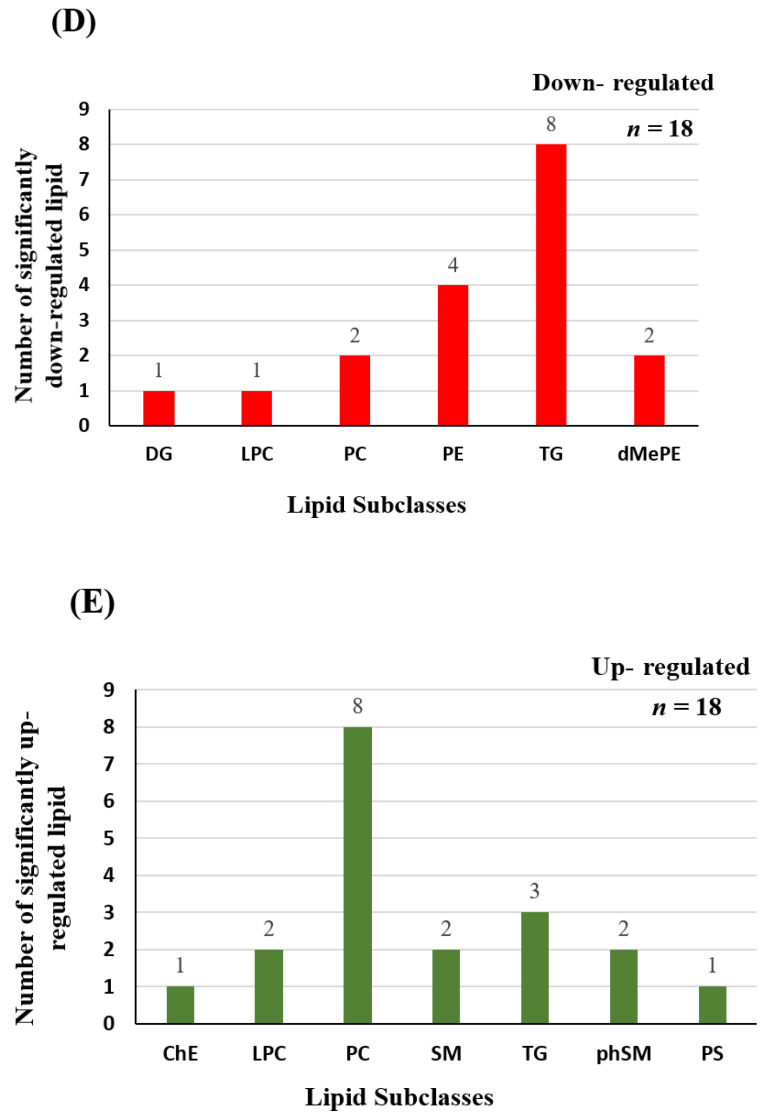
Figure 4.
Lipidomic dysregulation associated with OP and ON. (A) Venn diagram shows the determination of the dysregulated lipids associated with OP compared with ON from the panel of confounder- and medications-independent lipids (n = 329); based on the fold change trend (cutoff ≥2, and <0.8), 36 lipid molecules were dysregulated in OP compared with ON (B) The expression of the dysregulated lipid molecules (n = 36) was demonstrated, where 18 were up-regulated and 18 were down-regulated in OP, compared with ON. (C) A bar graph shows the subclasses’ dysregulated lipid molecules (n = 36). (D,E) Bar-graphs showing the distribution of down- (n = 18) and up-regulated (n = 18) lipid molecules in subclasses.


