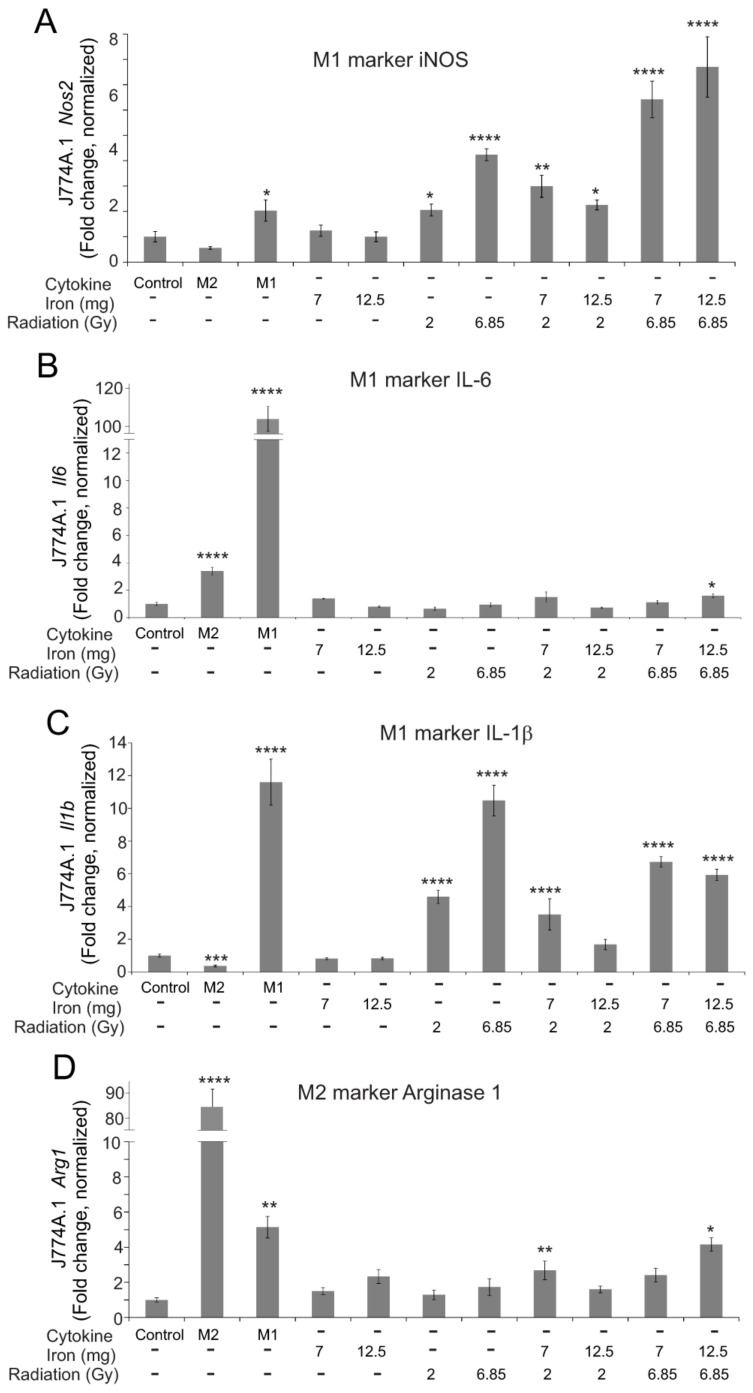
Figure 9.
Effects of radiation and high iron concentrations on J774A.1 murine macrophage polarity in culture. J774A.1 cells were grown to ~80% confluence, and untreated (control) exposed to either 7 or 12 mg/L Fe3+ and/or 2 or 6.85 Gy X-ray irradiation. As a control for M2 polarization, cells were treated with 100 ng/mL IL-4; as a control for M1 polarization, cells were treated with 100 ng/mL IFN-γ + 100 ng/mL LPS. 24 h post-irradiation, RNA was purified. qPCR was performed for M1 markers (Nos2 (A), Il6 (B), and Il1b (C)), and an M2 marker (Arg1 (D)). Gene expression was normalized to Gapdh, and fold increase was calculated relative to untreated cells (control). Graphs show means ± SEM, n = 3 independent experiments. Asterisks: * indicates p < 0.05 from control levels; ** indicates p < 0.01 from control; *** indicates p < 0.001 from control; and **** indicates p < 0.0001 from control.

