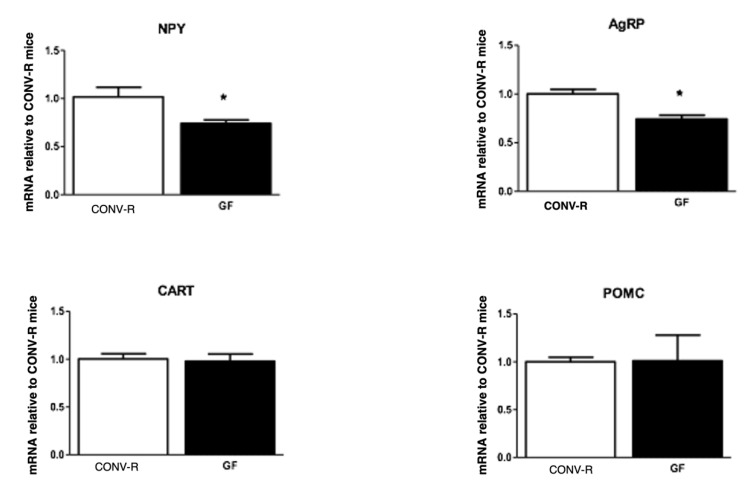
Figure 2.
mRNA expression of NPY, AgRP, POMC, and CART in the hindbrain of GF and CONV-R mice after a 5-h fast. mRNA expression of GF mice is relative to the mean level of their CONV-R counterparts. Data are expressed as means ± SEM. * denotes statistical difference between GF and CONV-R, * p < 0.05.

