Figure 3.
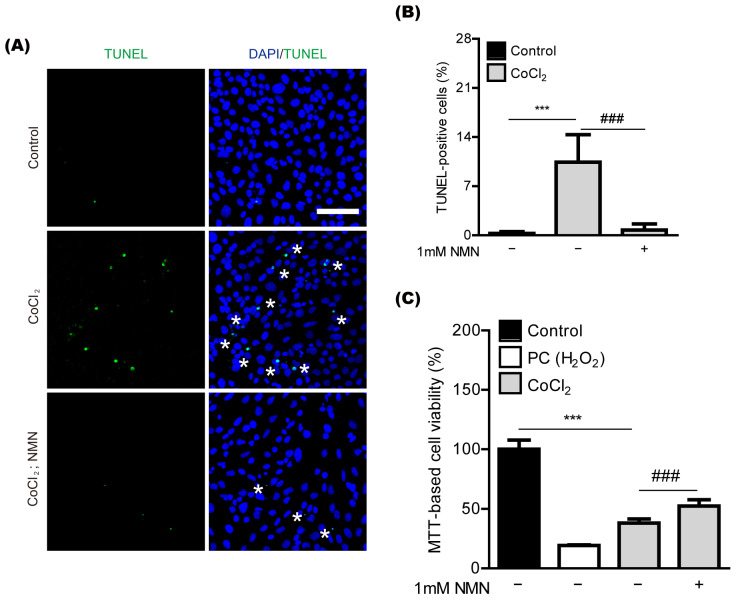
Neuroprotection in vitro by nicotinamide mononucleotide (NMN) treatment. (A,B) Representative pictures and quantitative analyses (n = 5 per group) demonstrated that the amount of oxidative stress-induced 661W cell death stained by TUNEL assay was reduced by 1 mM NMN treatment after 24 h of 400 μM of CoCl2 incubation. Scale bar: 100 μm. DAPI (blue); TUNEL (green); Stars (*) in pictures, TUNEL positive cells. *** p < 0.001 and ### p < 0.001. One-way ANOVA followed by a Bonferroni post-hoc test was used for the data analysis. Graphs are depicted as the mean ± standard deviation. (C) Quantitative analyses (n = 9 per group) demonstrated that MTT-based 661W cell viability increased by 1 mM NMN treatment after 10 h of 400 μM of CoCl2 incubation. *** p < 0.001 and ### p < 0.001. One-way ANOVA followed by a Bonferroni post-hoc test was used for the data analysis. Bar graphs are shown as the mean ± standard deviation. PC, positive control (250 μM of H2O2).

