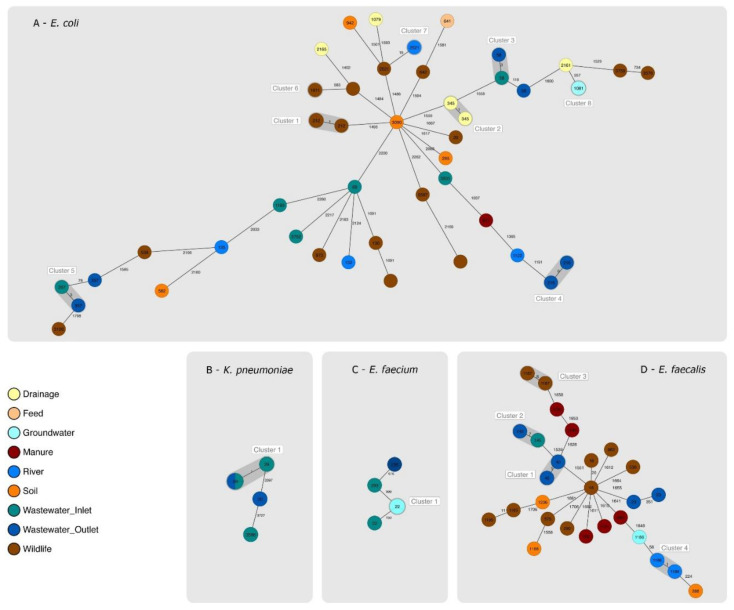
Figure 1.
Genetic relatedness between isolates of the same species based on their core genomes. STs are indicated inside each circle, which represents one or more isolates. Empty circles correspond to isolates with new STs. Clusters are highlighted in grey. Colors identify the compartment from which each isolate was gained. The number of allelic differences between two or more isolates is shown on the connecting lines between them. (A) Minimum spanning tree (MST) displaying the collected E. coli isolates; (B) MST displaying the collected K. pneumoniae isolates; (C) MST displaying the collected E. faecium isolates; (D) MST displaying the collected E. faecalis isolates.

