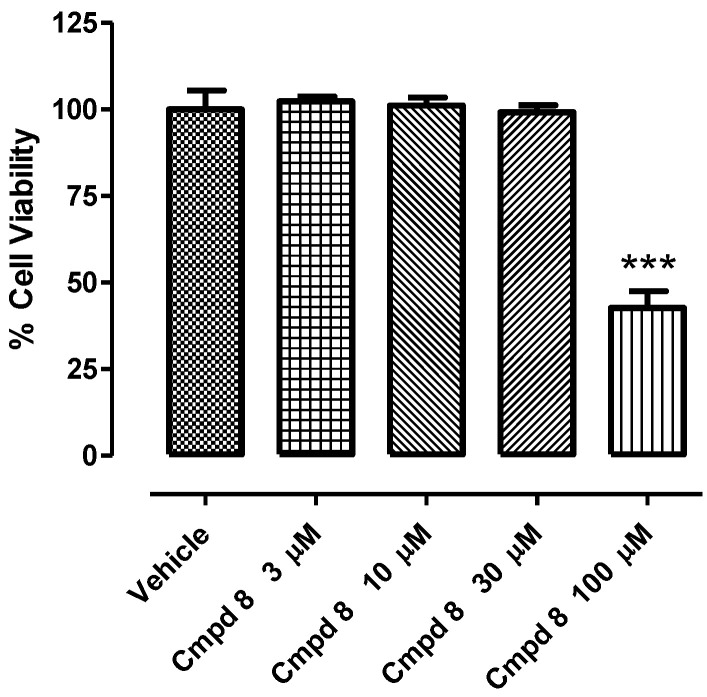
Figure 4.
Concentration–response of compound 8 in H9c2 cell line after 24 h of treatment. Cell viability is expressed as percentage of the vehicle. One-way ANOVA followed by Bonferroni post-test was used for the statistical analysis. * represents the statistical significance vs. vehicle (*** p < 0.001). Bars indicate mean ± SEM.

