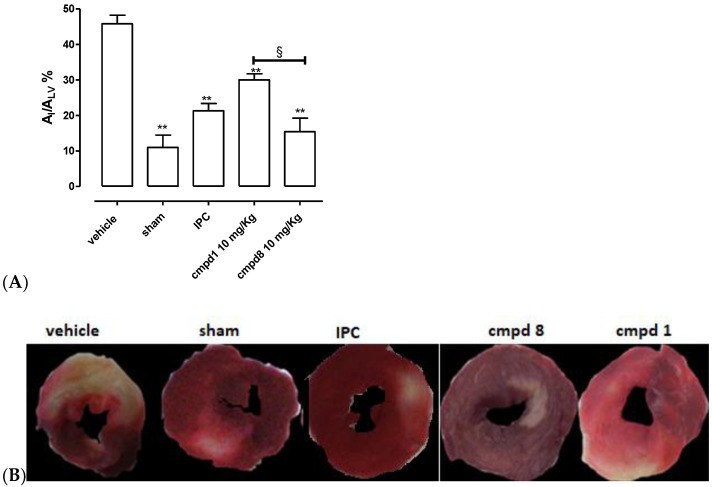
Figure 5.
(A) The histograms show the extent of the ischemic area (AI) compared with the total area of the left ventricle (ALV) in the different groups. Data are expressed as mean ± SEM. *indicates significant difference vs. vehicle (** p < 0.01). § indicates significant difference vs. compound 1 (resveratrol) group (§ p < 0.05). Number of animals used = 5. (B) Exemplificative pictures of several types of treatment groups.

