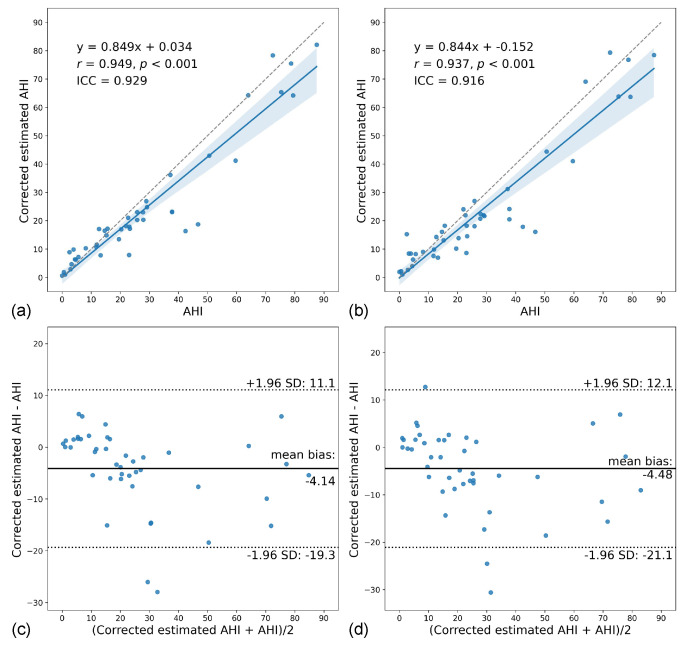
Figure 8.
Comparison of the corrected estimated AHI with the ground truth for the binary (a,c) and multiclass models (b,d). (a,b) Scatter plots of corrected estimated AHI versus AHI showing the linear regression line (blue line) with 95% confidence intervals (blue shadowed area). (c,d) Bland–Altman plots of corrected estimated AHI and AHI.

