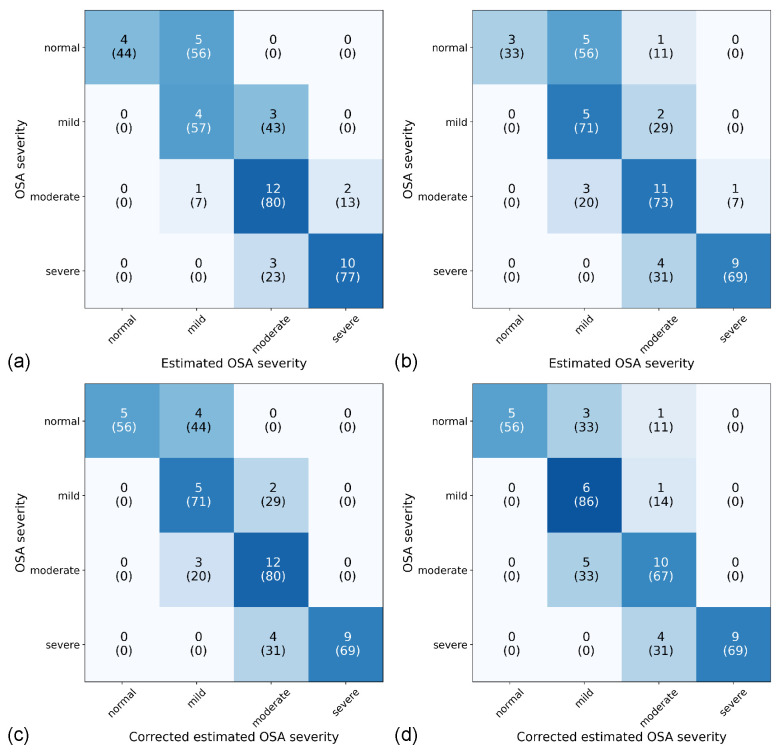
Figure 9.
Confusion matrices for the estimation of OSA severity of the binary (a) and multiclass (b) models and the corrected estimated OSA severity of the binary (c) and multiclass (d) models. Data are presented as the number of participants with the row-normalized percentage in parentheses. The colors of the cells correspond to the row-normalized percentage.

