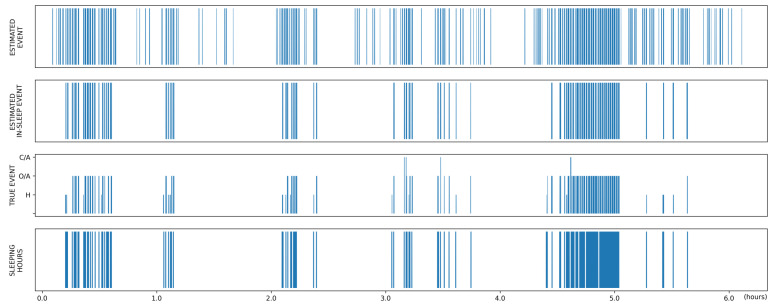
Figure 10.
Prediction result of a whole PSG recording from an example case with poor sleep efficiency. The first row shows the estimated abnormal respiratory events. When considering sleep status (last row), false-positive detections at waking hours are reduced (second row), resulting in predictions more similar to the ground truth (third row). H = hypopnea, O/A = obstructive apnea, C/A = central apnea.

