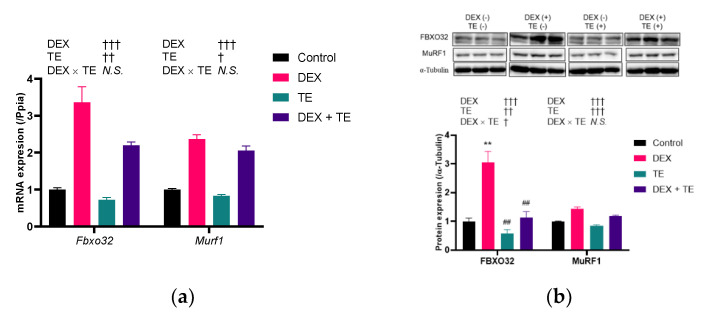
Figure 3.
Effects of 200 µM of turmeric extract (TE) on gene and protein expression of atrophy-related factors in dexamethasone (DEX)-treated C2C12 myotubes. (a) Gene expression of Fbxo32 and Murf1. (b) Protein expression of FBXO32 and MuRF1. The results are shown as the mean ± standard error. PCR experiment: n = 4; Western blotting: n = 3. Statistical analysis was performed by two-way ANOVA, and where an interaction effect was detected, multiple comparison test was performed by Tukey–Kramer test. The results of two-way ANOVA and multiple comparison test are shown above and in the figure, respectively. † p < 0.05, †† p < 0.01, ††† p < 0.001 in two-way ANOVA, ** p < 0.01 vs. Control, ## p < 0.01 vs. DEX in multiple comparison test, N.S.: not significant.

