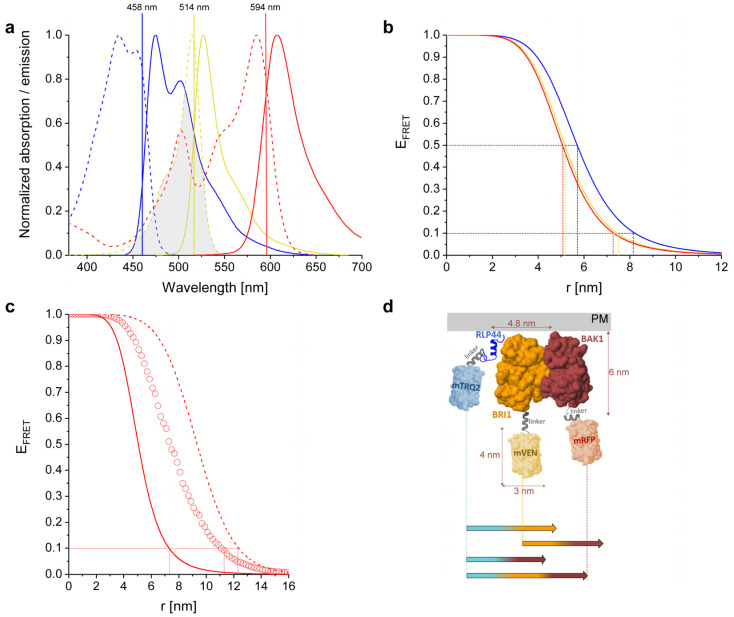
Figure 1.
Spectroscopic and FRET properties of the used fluorophores and dimensions of the analyzed RLP44-mTRQ2, BAK1-mVEN and BRI1-mRFP fusion proteins. (a) Normalized absorption (dotted lines) and emission (solid lines) spectra of mTRQ2 (blue), mVEN (yellow) and mRFP (red). mTRQ2 is donor to both mVEN as acceptor 1 as well as mRFP as acceptor 2; mVEN is also donor to mRFP. The shaded area corresponds to the spectral overlap between donor emission and acceptor absorption, shown here exemplary for the mTRQ2/mVEN FRET pair. The laser lines for excitation of mTRQ2 (blue), mVEN (yellow) and mRFP (red) are marked as vertical lines at their respective wavelength positions. (b) FRET efficiencies (EFRET) for the distances (r) between donor and acceptor fluorophores for mTRQ2-mVEN (blue), mVEN-mRFP (yellow) and mTRQ2-mRFP (red). The Förster distances R0 at EFRET = 50% as well as the distances that correspond to EFRET = 10% (r10%) for each pair are marked with dashed lines in the respective color. (c) EFRET in dependence of distance r between mTRQ2 and mRFP without (solid line) and with intermediate mVEN located either equidistantly (dashed line) or variably (circles) between mTRQ2 and mRFP. For the latter, mVEN was placed at 1000 random positions for each mTRQ2/mRFP distance, averaging over the resulting EFRET values. The r10% distances are marked with red lines. (d) Composite image of the cytoplasmic domains of RLP44 (blue), BRI1 (orange) and BAK1 (brown) fused to the 15 amino acid-long Gateway®-linker to either mTRQ2 (light blue), mVEN (light yellow) or mRFP (light red). The structures of the cytoplasmic domains of BAK1, BRI1 and the fluorophores are shown as solvent-accessible surface models, while the model structures of the cytoplasmic domain of RLP44 and the three Gateway®-linkers (grey) were predicted with PEP-FOLD3 and depicted as cartoons. The orientation of the kinase domains of BRI1 and BAK1 to each other was designed according to a molecular docking analysis in orientation to the PM [20]. The colored arrows below the structures show the r10% distances for all FRET pairs and the three-chromophore FRET cascade with mVEN inserted at random positions, calculated for a donor to acceptor complex ratio of 1:1. The precise values for b, c and d are listed in Table 1.

