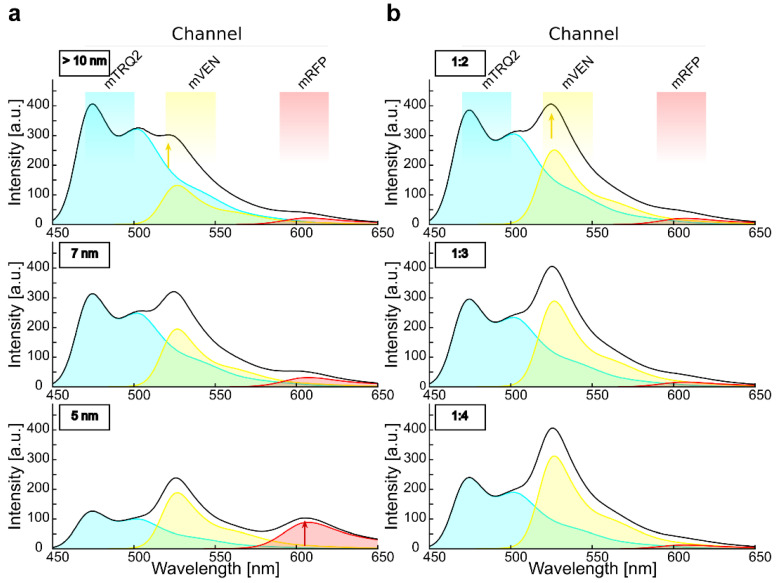
Figure 2.
Simulation of emission spectra reveals the crucial impact of relative fluorophore quantities for intensity-based spectral FRET in a three-chromophore arrangement. (a) Simulation of the spectra that result from excitation of mTRQ2 with 458 nm for a mTRQ2/mVEN/mRFP stoichiometry of 1:1:1 and in a linear arrangement while placing mVEN at an equal distance from the other two fluorophores. The emission spectra of mTRQ (blue area), mVEN (yellow area) and mRFP (red area) and their combined spectrum (black line) are calculated. The respective emission detector channels are depicted above the plots. With inter-fluorophore distances larger than 10 nm, FRET is negligible (top), but cross-excitation of mVEN (yellow arrow) is apparent. For inter-fluorophore distances of 7 nm (middle) and 5 nm (bottom), FRET lowers the emission intensity of mTRQ2, while the intensity peaks increases around the emission of mVEN at 525 nm and of mRFP at about 610 nm (red arrow) increase. (b) Spectra simulation as in (a), but without consideration of FRET, calculated for different mTRQ2/mVEN fluorophore ratios. With rising mTRQ2/mVEN ratios of 1:2 (top), 1:3 (middle) and 1:4 (bottom), the intensity peak of mVEN (yellow arrow) increases. Thus, a mTRQ2/mVEN ratio of 1:2 ((b), top) results in a similar spectral shape than with equimolar fluorophores subjected to FRET at a distance of 7 nm ((a), middle).

