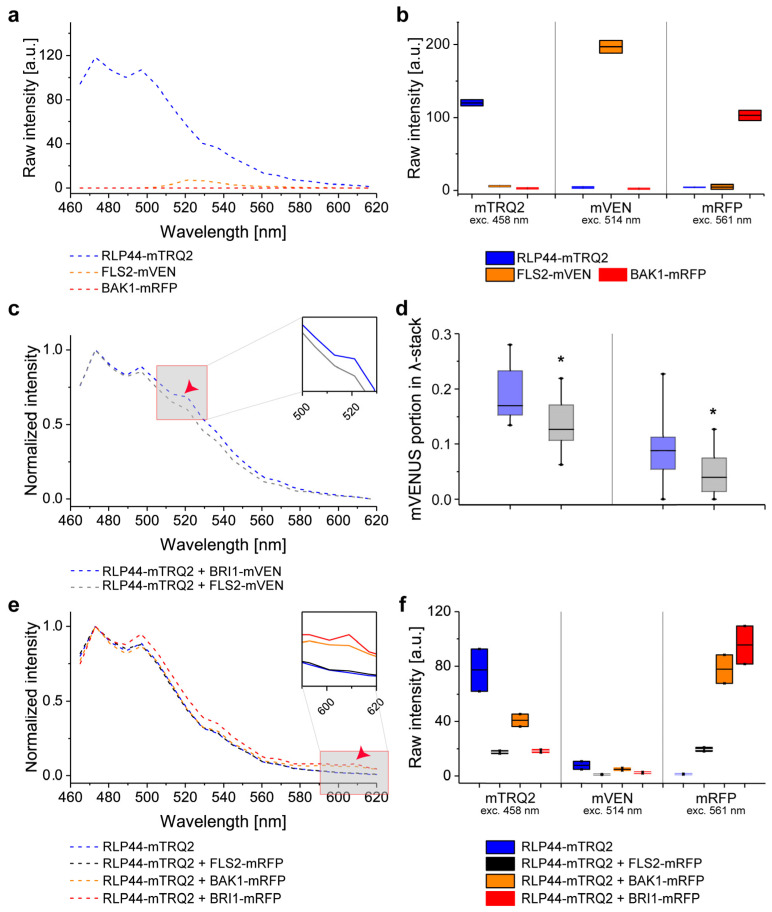
Figure 3.
Interaction of RLP44 with BAK1 and BRI1 is detectable in the plasma membrane of N. benthamiana epidermal leaf cells by intensity-based spectral FRET. (a) Wavelength-dependent intensity of fluorescence emission after irradiation of the cells with 458 nm light for RLP44-mTRQ2 (blue), FLS2-mVEN (orange) and BAK1-mRFP (red). (b) Emission intensity after irradiation with light of different wavelengths in the mTRQ2 (left, 458 nm), mVEN (middle, 514 nm) and mRFP channels (right, 561 nm) from 8-bit images for RLP44-mTRQ2 (blue), FLS2-mVEN (orange) and BAK1-mRFP (red) after correction for spectral bleed-through. (c) Wavelength-dependent normalized fluorescence emission for RLP44-mTRQ2 co-expressed with BRI1-mVEN (blue) or with FLS2-mVEN (grey). For both spectra, the average donor-to-acceptor ratio was around 1:4 (0.26). The FRET-relevant wavelength area is as an inset and the occurrence of FRET from RLP44-mTRQ2 to BRI1-mVEN is indicated by a red arrow head. The data are presented as the mean (n ≥ 13). (d) Protein-dependent, relative mVEN emission signal after irradiation of the cells with light of 458 nm light. Fusion protein ratios of about 1:4 (left) and 1:10 (right) of the RLP44-mTRQ2/BRI1-mVEN pair (blue) and RLP44-TRQ2/FLS2-mVEN pair (grey) are shown. Significant changes [n = 7 (left), n = 12 (right)] in a two-sided 2-sample t-test with p < 0.05 are indicated by asterisks. (e) Wavelength-dependent normalized fluorescence emission after irradiation of the cells with 458 nm light for RLP44-mTRQ2 alone (blue), RLP44-mTRQ/FLS2-mRFP (black), RLP44-mTRQ/BAK1-mRFP (orange) and RLP44-mTRQ/BRI1-mRFP (red). The FRET-relevant wavelength area is highlighted in an enlarged section and the occurrence of FRET fromRLP44-mTRQ2 to BAK1-mRFP or BRI1-mRFP is indicated by a red arrow head. (f) Emission intensity after irradiation of the cells with light of different wavelength in the mTRQ2 (left), mVEN (middle) and mRFP channel (right) from 8-bit images for of RLP44-mTRQ2 (blue), RLP44-mTRQ/FLS2-mRFP (black), RLP44-mTRQ/BAK1-mRFP (orange) and RLP44-mTRQ/BRI1-mRFP (red). For further details see (b). For the statistical evaluation see Section 4. Boxplots in (b) and (f) represent the measured data with the average as a solid black line and the box limits are the mean +/− standard deviation. The boxplot in (d) represents all data with the median as a solid black line within the box that is restricted by the first quartile (25%; lower end) and the third quartile (75%; upper end). Whiskers show the minimum and maximum of the measurements, respectively.

