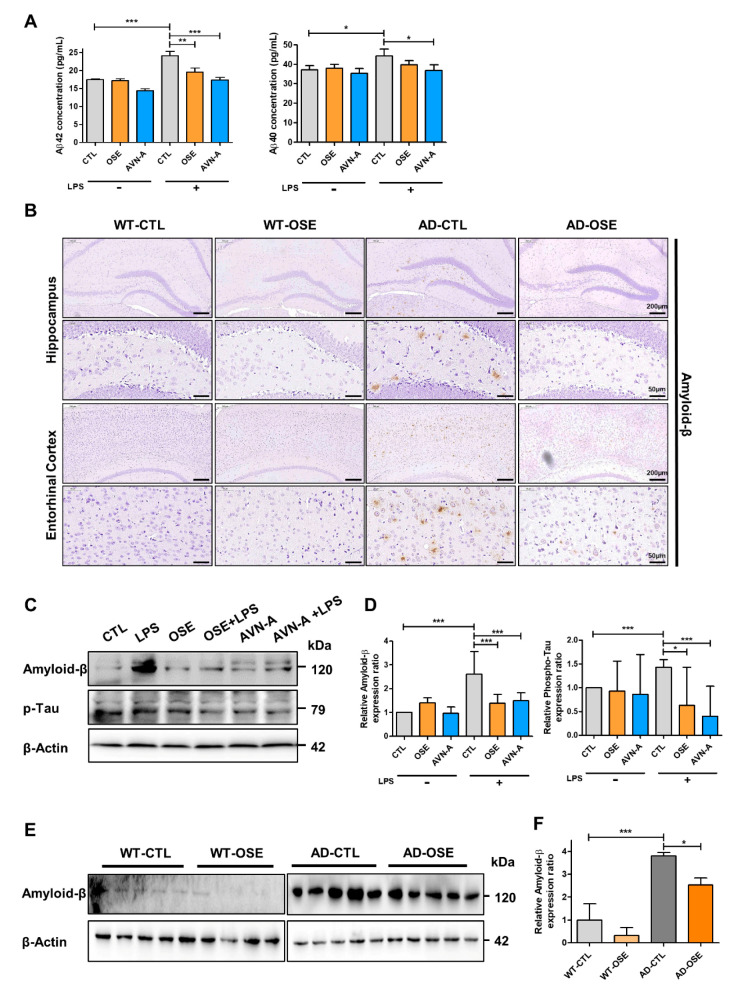
Figure 2.
OSE and AVN-A exposure lowers the deposition of Aβ in Tg-5xFAD AD mice. (A) The Aβ42 and Aβ40 in the cell lysate were measured by color metric ELISA assay. (B) Representative images of Aβ deposition in the CA1 region of the hippocampus and entorhinal cortex of Tg-5xFAD AD and WT mice. (C,E) Cell lysates (30 µg) of each treated cell line and in vivo were immunoblotted (IB) with indicated antibodies. (D,F) Validation of differentially expressed proteins were done by Western-blot analysis. * p < 0.05, ** p < 0.01, *** p < 0.001.

