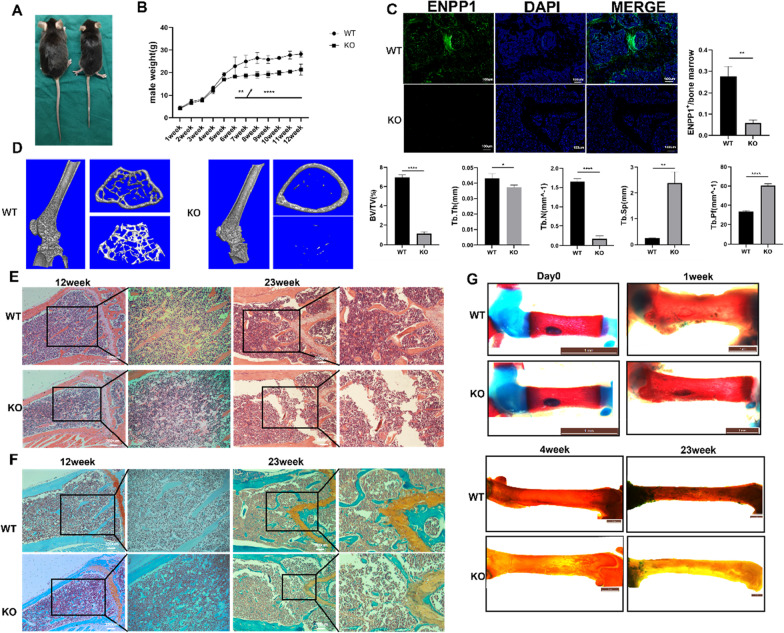
Fig. 1.
Histology and micro-computed tomography of trabecular bone in femur. A The body size of wild-type (WT) (left) and knockout (KO) (right) mice was compared after anesthesia at 12 weeks of age. B Body weights of 3–4 mice from each group were noted. C Immunofluorescence staining and quantification of the expression of Enpp1 (green) in mouse distal femur. Cell nuclei were stained blue using DAPI. Scale bar: 100 µm. D Representative μCT scans of the distal femur showed 3D reconstructed trabecular bones of WT and KO mice at 12 weeks of age. Quantitative analysis of the percentage of bone volume (BV/TV), trabecular thickness (Tb. Th), trabecular number (Tb. N), trabecular spacing (Tb. Sp), trabecular pattern factor (Tb. Pf) (n = 3) was conducted. E Hematoxylin and eosin staining and F saffron solid green staining images of femur near the metaphysic area of 12- and 23-week-old mice. The right panel shows a higher magnification(X100). G Alcian blue and Alizarin Red staining of femur of mice from birth to 23 weeks of age (cartilage elements and bones are labeled in blue and red, respectively). Densitometric analysis (mean + SD) from three independent experiments is presented

